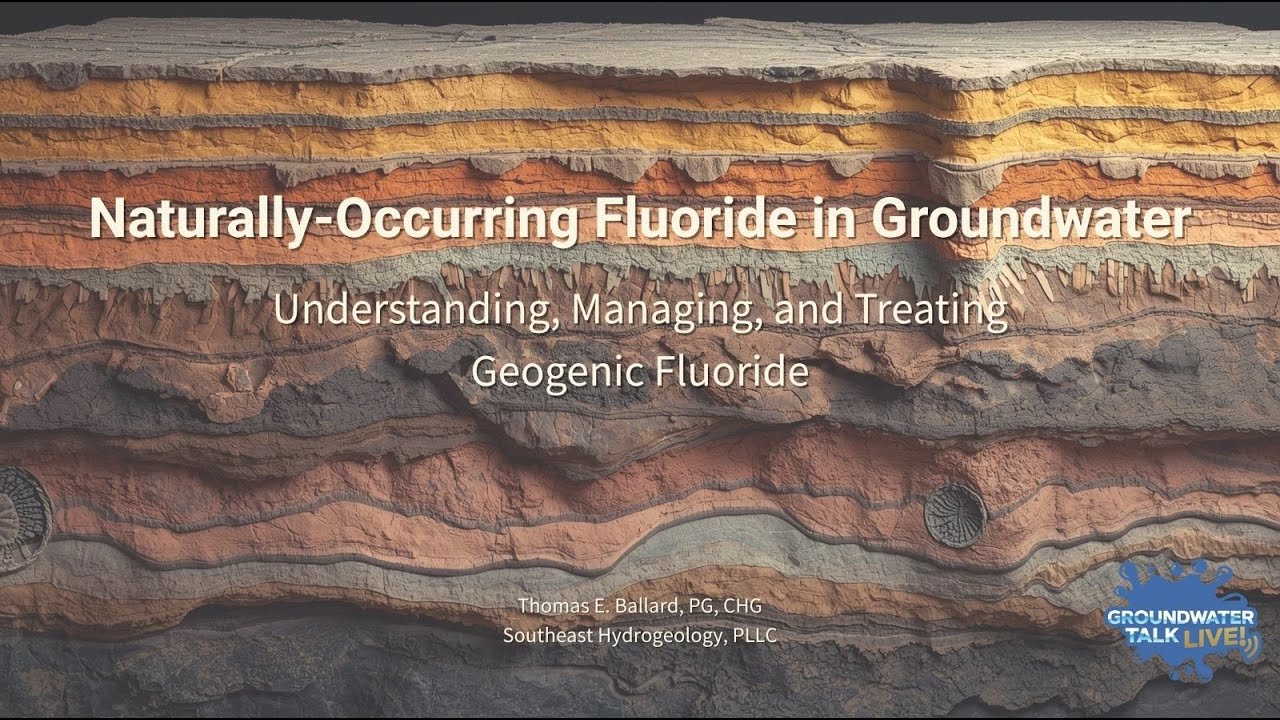
I routinely get asked about Naturally-Occurring Fluoride and how it ends up in drinking water. In this article I outline what causes high Naturally-Occurring Fluoride in groundwater, how to predict where it will appear, and the practical steps small water systems can take to manage, treat, and monitor it. I walk through geology, geochemistry, well construction, blending strategies, treatment technologies, monitoring schedules, emergency response, and real-world examples that show what works and why.
Why Naturally-Occurring Fluoride matters
Naturally-Occurring Fluoride is a geogenic constituent of many aquifers around the world. It has no taste, color, or odor, so you cannot detect it without laboratory testing. Regulatory agencies treat high levels as a drinking water concern because excess fluoride can cause dental fluorosis and more serious skeletal fluorosis at elevated, chronic exposures.
For reference, the U.S. EPA maximum contaminant level is 4 milligrams per liter. That threshold is where health concerns move from largely cosmetic dental effects to more severe skeletal impacts. At lower concentrations there is a narrow range where fluoride can reduce dental decay, but that is not the focus here. My focus is specifically on Naturally-Occurring Fluoride in source groundwater and how to avoid or fix problem supplies.
What produces Naturally-Occurring Fluoride: minerals and rock types
Fluoride in groundwater comes from fluoride-bearing minerals in the aquifer matrix. The primary mineral is fluorite, which is calcium fluoride and contains a high proportion of fluoride by weight. Other contributors include cryolite, fluorapatite, biotite and other micas, hornblende and amphiboles, and volcanic glass. Even trace amounts of these minerals can lead to high Naturally-Occurring Fluoride if the water chemistry is favorable for dissolution.
Typical rock types associated with elevated Naturally-Occurring Fluoride include granitic and rhyolitic crystalline rocks, alkaline igneous bodies, volcanic terrains with silica-rich lavas, geothermal areas around hot springs and recent volcanism, and phosphate-rich sedimentary sequences. In arid areas, evaporite and playa deposits may concentrate fluoride-bearing minerals and salts, producing locally high concentrations.
Geochemical controls: why chemistry matters more than mineral abundance
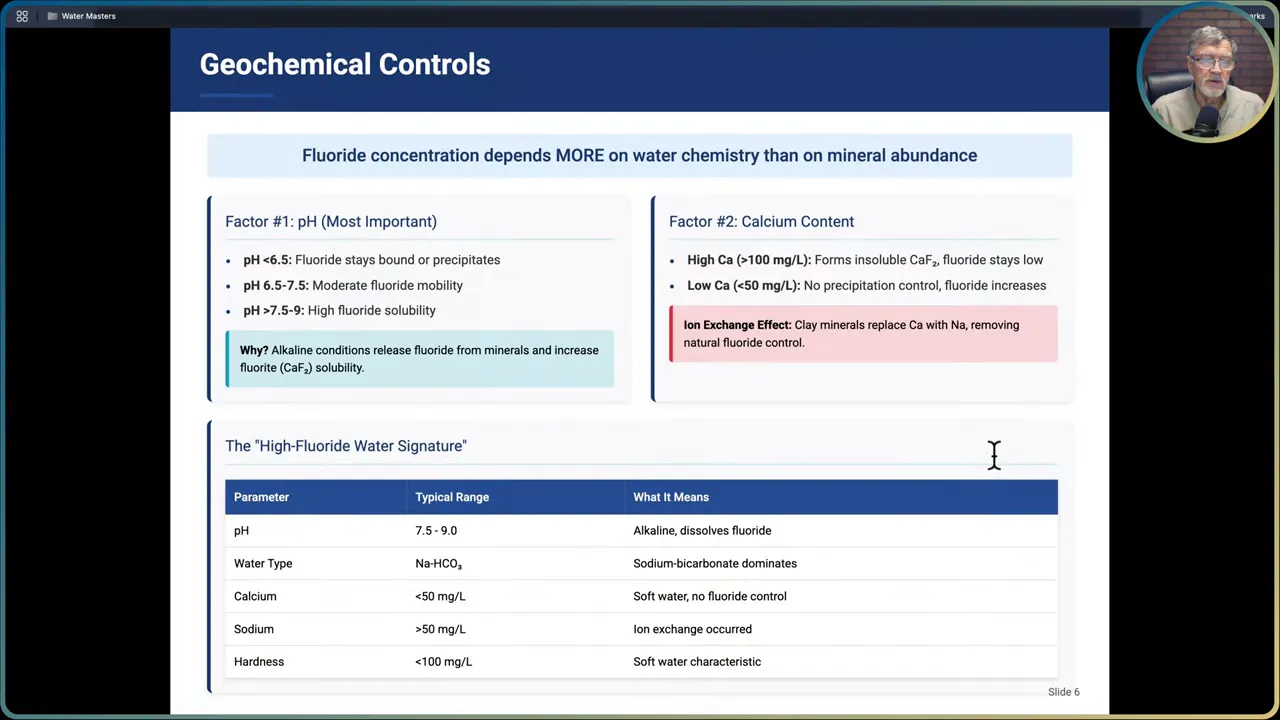
I emphasize this point: fluoride concentration in groundwater depends more on water chemistry and residence time than simply how much fluoride-bearing mineral is present. Three chemical controls are most important.
- pH: pH is the dominant control. Acidic waters (pH less than 6.5) generally hold fluoride in solid phases or bound to mineral surfaces and therefore have low dissolved fluoride. Between pH 6.5 and 7.5 you may see moderate fluoride mobility. Alkaline waters (pH above 7.5 and up into the 9 range) greatly enhance fluoride dissolution and solubility.
- Calcium concentration: dissolved calcium forms relatively insoluble complexes with fluoride (calcium fluoride). When calcium is high, fluoride tends to be suppressed by precipitation. When calcium is low (less than about 50 mg/L), there is less precipitation control and dissolved fluoride can increase.
- Ion composition and exchange: sodium-bicarbonate-type water with high sodium and bicarbonate, low calcium, and low hardness is a classic signature for high Naturally-Occurring Fluoride. Clay mineral ion exchange that replaces calcium with sodium also removes natural controls on fluoride, promoting higher dissolved concentrations.
Additional factors include residence time (long contact time with rock favors higher fluoride), climate (semiarid climates concentrate fluoride through evapotranspiration and low recharge), and elevated temperatures in geothermal systems that speed up dissolution.
Typical groundwater fingerprint for high Naturally-Occurring Fluoride
When I look at a water chemistry report and see the following, I start thinking fluoride risk:
- pH 7.5 to 9.0
- Sodium-bicarbonate water type
- Low calcium (less than 50 mg/L)
- Hardness less than roughly 100 mg/L as CaCO3
These conditions do not guarantee high Naturally-Occurring Fluoride, but they create an environment where fluoride-bearing minerals dissolve readily.
Groundwater flow patterns and depth stratification
Fluoride concentrations are strongly influenced by groundwater flow systems. Shallow, local flow systems with recent recharge usually have short residence times and lower fluoride. Intermediate flow systems can show transitional chemistry. Regional, deep flow systems with long residence times commonly have the highest Naturally-Occurring Fluoride.
Depth stratification is predictable in many settings where fluoride is a problem. I often see the following pattern in aquifers that contain fluoride-bearing minerals:
- 0 to 50 feet: low fluoride, higher calcium, lower pH, influenced by recent recharge
- 50 to 200 feet: transitional chemistry, fluoride may be 1 to 4 mg/L depending on conditions
- Below 200 feet: sodium-bicarbonate type, higher pH, low calcium, often greater than 4 mg/L in problem aquifers
Because fluoride often increases with depth, well design and completion decisions can make the difference between producing acceptable water and requiring expensive treatment.
Source water management strategies: prevent before you treat
Prevention is almost always less expensive and more reliable than long-term treatment. If you are in a region with any geological risk for Naturally-Occurring Fluoride, the first actions I recommend are:
- Consider alternative sources: surface water, sand and gravel aquifers, shallow dug wells where geology allows, or interconnections with neighboring utilities that have low fluoride.
- Site and locate wells to avoid granite, rhyolite, volcanic, and geothermal terrains when possible. Target upper aquifer zones with higher recharge and shorter residence times.
- If drilling is necessary, plan for vertical profiling and depth sampling so you can complete wells selectively. Seal off high fluoride zones and only screen low fluoride intervals.
For new wells in known fluoride areas I always recommend sampling during drilling. Take samples every 50 feet after entering bedrock or as the geologist suggests. That profile will let you design a completion that minimizes fluoride at the point of withdrawal.
Well completion case example
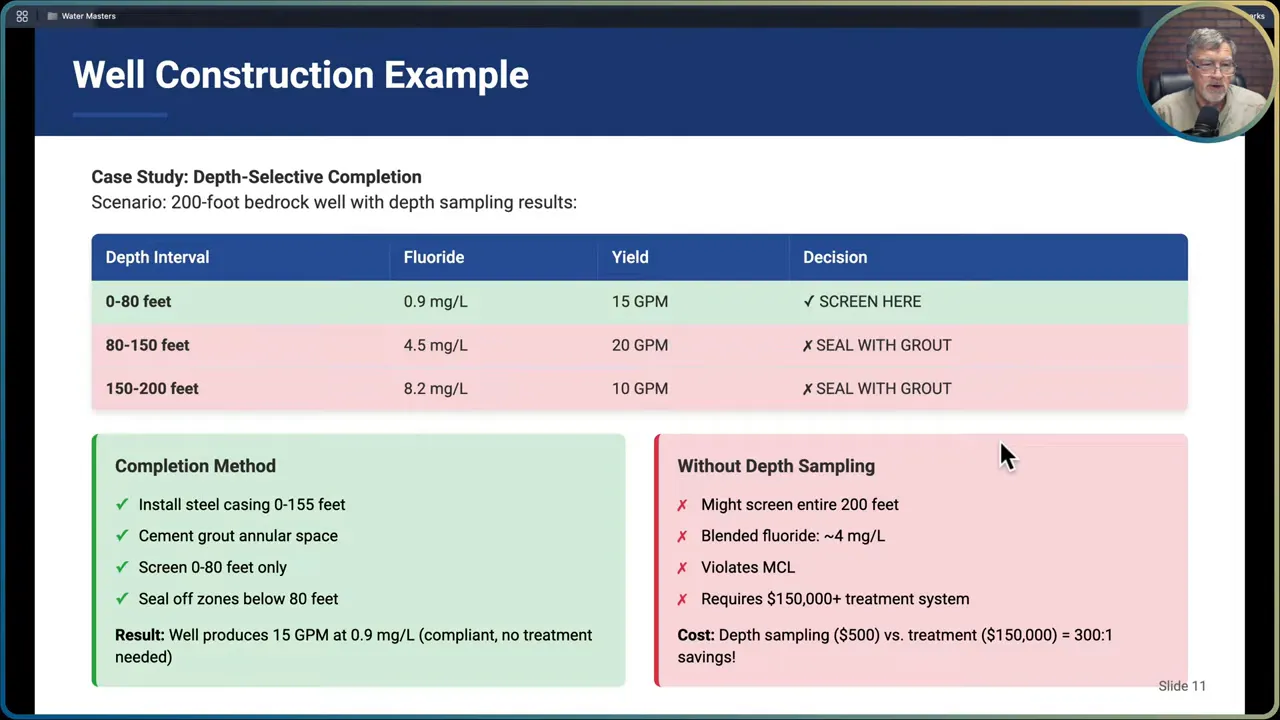
Imagine a 200-foot bedrock well with depth samples showing:
- 0 to 80 feet: fluoride 0.9 mg/L, yield 15 gpm
- 80 to 150 feet: fluoride 4.5 mg/L, yield 30 gpm
- 150 to 200 feet: fluoride 8.2 mg/L, yield 30 gpm
If you screen the entire interval without profiling, you will blend those waters and produce a fluoride concentration around 4 mg/L or more—triggering treatment requirements. If you instead case off the deeper zones and only screen the upper 0–80 feet, the well will yield a lower flow, perhaps 15 gpm, but it produces water at less than 1 mg/L fluoride without treatment. That difference can change project costs from a small well completion to a six-figure treatment system.
Blending multiple sources: a cost-effective option
Blending is a widely used, legitimate technique for mitigating Naturally-Occurring Fluoride and other geogenic contaminants. If you have two or more wells with different fluoride concentrations and a common distribution system, you can mix them in proportions that produce compliant finished water. Blending avoids chemical residues and often requires lower capital outlay than treatment.
Here is a simple blending example I use during planning. Suppose:
- Well A produces 200 gpm at 0.5 mg/L fluoride
- Well B produces 100 gpm at 5 mg/L fluoride
Blended concentration Cblend = (Q1*C1 + Q2*C2) / (Q1 + Q2).
Plugging in numbers: Cblend = (200*0.5 + 100*5) / (300) = (100 + 500) / 300 = 600 / 300 = 2 mg/L.
At 2 mg/L the system is under the 4 mg/L MCL and acceptable from a fluoride standpoint. The catch is that both sources must be reliable and you need flow control and metering, regulatory acceptance, and robust monitoring to ensure the blend stays within limits.
Treatment technologies for Naturally-Occurring Fluoride
When source control and blending are not options, treatment becomes necessary. For small water systems the two most practical full-scale treatment choices are reverse osmosis and activated alumina. Point-of-use options include bone char and distillation for individual homes, but those are not practical for community systems.
Reverse osmosis (RO)
RO typically removes 85 to 95 percent of fluoride. Water is forced through semi-permeable membranes at pressures between roughly 150 to 250 psi. Dissolved solids, including fluoride, are concentrated in the reject stream or brine, which must be managed or disposed of properly.
Advantages of RO:
- High removal rates across a wide pH range
- Can remove multiple contaminants simultaneously
- Proven, automated, and relatively low maintenance
Disadvantages:
- Higher capital cost: typical community RO installations can range from about $150,000 to $750,000 depending on scale and complexity
- Produces 25 to 50 percent reject water that must be handled
- Energy intensive and membranes require periodic cleaning and replacement
Operating parameters I track for RO: feed pressure, system recovery (50 to 75 percent target), daily and weekly product water checks with target product fluoride typically under 1 mg/L for systems targeting compliance, and membrane cleaning when feed pressure requirement changes significantly.
Activated alumina
Activated alumina removes fluoride by adsorption/ion exchange onto porous aluminum oxide media. It can achieve 90 to 95 percent removal when operated under the right conditions, but is highly sensitive to pH and other water chemistry.
Key constraints and operational notes for activated alumina:
- Optimal pH is between 5.5 and 6.5. Removal efficiency drops sharply above pH 7.0.
- High alkalinity and silica can reduce capacity and require more frequent regeneration or media replacement.
- For pH adjustment you typically need acid addition (sulfuric) or carbon dioxide contact, so the chemical handling and operator skill requirement is higher.
- Media management options are single-use replacement or regenerable reuse; replacement costs depend on flow and contact time but rough order of magnitude per media change might be in the single-digit thousands for very small systems to tens of thousands for larger systems.
Where the raw water pH is naturally above about 8, I usually favor RO over activated alumina because the required pH correction becomes costly and operationally complex.
Choosing the right option: considerations
When thinking through whether to treat, blend, or change source, ask these questions:
- What is the system size and number of connections?
- What does the raw water chemistry look like: pH, alkalinity, silica, sulfate, calcium, TDS?
- Are multiple sources available for blending and can they be metered and controlled reliably?
- What is the operator skill level and available maintenance resources?
- What funding is available for capital and ongoing O&M?
For individual homes, point-of-use RO is often the cheapest immediate fix. For community systems with a skilled operator and raw water pH less than 7, activated alumina can be economical. For most other community settings, especially where multiple contaminants exist or operator resources are limited, RO is my preferred option despite higher capital costs because it is robust and flexible.
Monitoring requirements and operational tracking
Monitoring is essential whether you choose source management, blending, or treatment. For community systems with more than 25 connections I recommend at minimum an annual fluoride test if levels are historically low, and quarterly testing if near the MCL. When values reach two mg/L or higher you should increase frequency—quarterly becomes the regulatory minimum and monthly sampling is prudent. If you have a treatment plant in operation monitor influent and effluent fluoride weekly and track trends closely.
Parameters to monitor include:
- Fluoride (entry points, raw water, treated effluent)
- pH and temperature
- Alkalinity, calcium, magnesium, total dissolved solids
- If using activated alumina, monitor aluminum in the treated water
- Operational variables: flow rates, system pressure, run times, chemical usage, filter pressures
I cannot overstate the value of digitizing records and reviewing trends. Trend analysis helps predict media breakthrough, membrane fouling, or changes due to increasing pumping. Early action saves money and prevents public health impacts.
Health effects, vulnerable populations, and communication
At fluoride concentrations below roughly 1.5 mg/L the primary concerns are dental and largely positive at very low dosages for dental health. Above 1.5 mg/L calcified tissues may start to show fluorosis effects in children during tooth development. When levels exceed the MCL of 4 mg/L chronic exposure can lead to skeletal fluorosis, which is a serious condition impacting bones and joints.
Vulnerable populations include infants preparing formula with tap water, children under eight years old during tooth development, elderly individuals with cumulative exposure, and people with impaired renal function who cannot clear fluoride efficiently.
When communicating with customers about Naturally-Occurring Fluoride, be clear, transparent, and timely. Explain that the issue is geogenic, not industrial pollution. Provide specific levels in plain language, explain potential health impacts, describe the utility action plan, and give timelines. Offer alternate water sources or bottled water to vulnerable households if an MCL is exceeded while you implement a solution.
Prevention is always cheaper than treatment.
Emergency response if you exceed the MCL
If you receive a sample showing fluoride above 4 mg/L take these steps immediately:
- Confirm the result with a second sample within 24 hours.
- Notify your state drinking water authority as required.
- If feasible, take the affected source out of service immediately.
- Within 30 days provide public notification to all customers and post notices at community locations. Prioritize alternative water for vulnerable populations.
- Implement an interim solution such as blending, a temporary RO unit, or hooking to a low-fluoride source while you design a long-term fix.
- Monitor fluoride concentrations weekly and keep the public informed about corrective measures and timelines.
Note: Do not issue a boil water advisory to address fluoride. Boiling concentrates fluoride and worsens exposure. Boil water orders are for microbiological contamination only.
Case studies: lessons from the field
New Hampshire bedrock wells
In southeastern New Hampshire I have seen naturally elevated fluoride in granitic bedrock. About 5 percent of bedrock wells in that region exceed 2 mg/L, and concentrations often increase with depth. Local solutions there were tailored to the community and included:
- Drilling and selectively completing shallow wells where yield permitted (shallow dug wells often avoid fluoride but have other risks).
- Point-of-use RO for individual homes for a low-cost immediate solution, roughly $1,000 to $1,500 per unit depending on configuration.
- Connecting to municipal water where available or drilling replacement wells in low-fluoride intervals discovered through neighbor well surveys and profiling.
Key lessons: test before completion, profile during drilling, learn from neighboring wells, and document results to build regional knowledge.
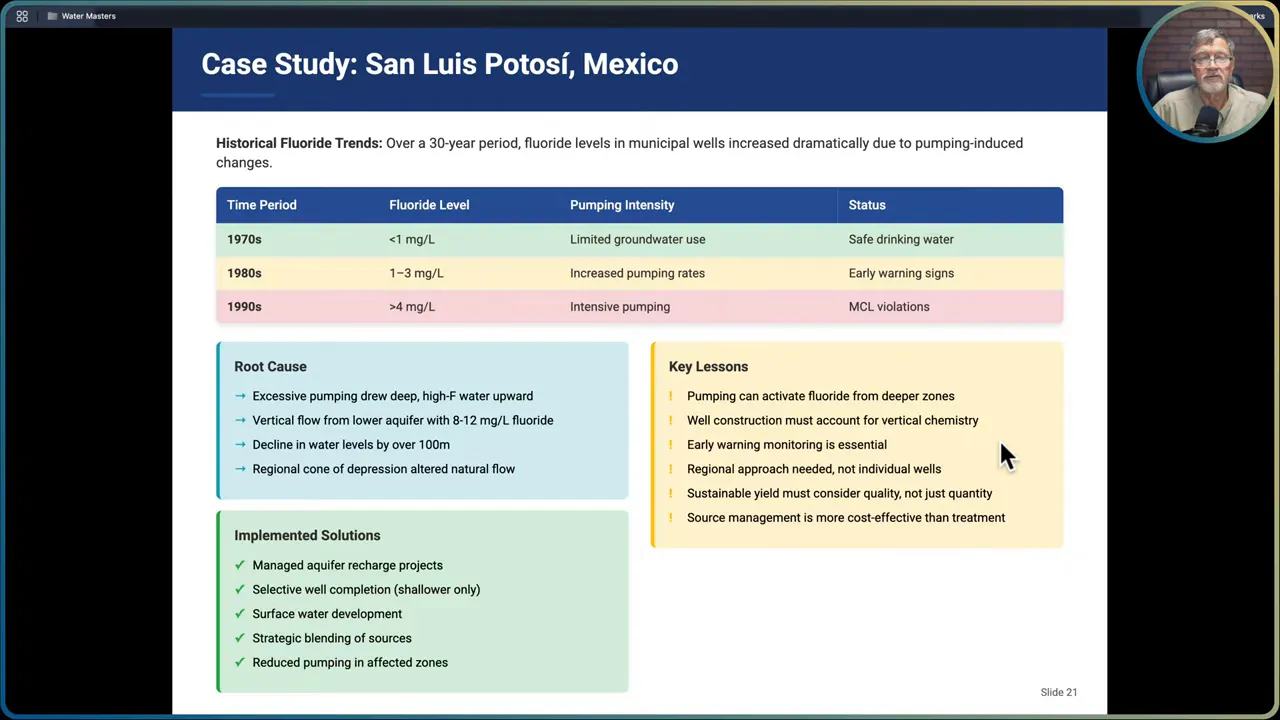
San Luis Potosi, Mexico: pumping-induced activation
A classic example of how pumping changes chemistry comes from San Luis Potosi. In the 1970s municipal wells showed fluoride less than 1 mg/L. Over two decades of increased groundwater extraction the system changed: pumping induced vertical flow from deeper, high-fluoride zones (8 to 12 mg/L) and by the 1990s wells were often above 4 mg/L. The problem was not new minerals but the mobilization of deep, high-fluoride water through pumping.
Responses there included aquifer recharge to dilute fluoride, selective well completion based on vertical profiling, surface water development, strategic blending, and reducing pumping in affected zones. The lesson is clear: sustainable yield must consider water quality as well as quantity. Intensive pumping can convert a previously acceptable supply into a health risk.
Action plan checklist for utilities
When you face potential or existing Naturally-Occurring Fluoride issues, follow a structured approach:
- Phase 1 assessment: test all current wells, review geological maps, and complete a full chemistry analysis.
- Identify high-risk areas and determine compliance status for each source.
- Develop options: evaluate alternative sources, calculate blending possibilities, and gather treatment vendor quotes.
- Consider well construction options including selective completion and profiling.
- Calculate capital and O&M costs, identify funding sources, and secure permits.
- Design and construct the chosen solution, train operators on new processes, and implement monitoring and reporting.
Top takeaways on Naturally-Occurring Fluoride
- Geology predicts risk: granitic, volcanic, alkaline igneous, and geothermal areas are higher risk for Naturally-Occurring Fluoride.
- Test before you complete a well: depth profiling during drilling avoids expensive retrofits.
- Chemistry is key: sodium-bicarbonate waters, high pH, and low calcium favor fluoride mobility.
- Fluoride often increases with depth: deeper regional flow systems are common sources of high concentrations.
- Pumping can activate deep fluoride: overpumping can draw up high-fluoride water and change water quality across an aquifer.
- Prevention beats treatment: source selection, well design, and blending are often the most cost-effective solutions.
- Treatment works but costs: RO and activated alumina are effective but require capital, operations, and monitoring.
- Blending is legitimate: when available it is low cost and simple compared to full-scale treatment.
- Plan long term: design solutions with a 20-year horizon and build monitoring into asset management.
Resources, funding, and next steps
Technical resources are available through groundwater and water utility associations, state drinking water programs, and online groundwater texts. Funding sources for mitigation include state revolving funds, USDA rural development programs, EPA water infrastructure finance mechanisms, and state infrastructure banks. If you face a fluoride problem, assemble the hydrogeologic data, estimate costs for both source management and treatment, and pursue the funding route that fits your scale.
Questions to guide your local response
Ask these of your utility or community:
- Have you ever detected Naturally-Occurring Fluoride above background levels?
- Are you in a geological setting prone to fluoride?
- Do you see vertical stratification or trends in historical data?
- Have fluoride levels changed as a result of pumping increases?
- Are interconnects or alternative sources viable?
- Would selective well completion or blending be feasible?
- How do treatment and source management compare in lifecycle cost?
Answering these will guide whether you should invest in profiling, blending infrastructure, RO, or activated alumina.
Final thoughts
With the right testing, planning, and monitoring, utilities and homeowners can manage Naturally-Occurring Fluoride effectively. The cheapest and most sustainable path is to understand the geology and chemistry up front, use well construction and blending strategically, and reserve treatment for situations where source management is not feasible. If you design for the long term and keep good data, you can protect public health without unnecessary expense.
If you are assessing wells in a region with potential fluoride risk, start with a simple profiling plan: test during drilling, sample at 50-foot intervals after bedrock is penetrated, and log chemistry trends. That single practice will save you money and headaches down the line.