Leaks and midnight callouts are expensive. Too often those emergency repairs happen in the middle of the night, when crews are roused out of bed, trucks are dispatched under urgency, and temporary fixes must be made at a premium. The root cause is simple: many distribution systems hold daytime pressure 24 hours a day. That creates persistent overpressurization during low demand periods, which enlarges tiny defects, pushes water through weak joints, and eventually leads to main breaks and expensive emergency responses. Pressure modulation is the targeted, data-driven strategy that fixes that problem.
This article is a step-by-step, practical guide to designing, piloting, and scaling a pressure modulation program for small water utilities. It lays out a six-step best management framework, explains the physics linking pressure to leakage, reviews valve technologies and SCADA integration options, and gives a realistic ROI and phased implementation plan you can take to your board. If you want to reduce non-revenue water, lower energy costs, and extend the life of your assets, this is where to start.
Step 1: Define clear objectives
Every successful pressure modulation program begins with a clearly defined set of objectives. Before touching a valve or buying a data logger, identify the problems you want to solve, and set measurable targets so you can show progress to your board and community.
What to identify
- Primary pain points in the distribution system: frequent night-time leaks, specific high-pressure corridors, critical customer complaints.
- Measurable goals tied to utility performance: reduce non-revenue water to 10-15 percent, cut main break frequency by 18-30 percent, lower energy use and pumping hours by a set percentage, improve customer pressure consistency.
- Operational constraints: regulatory minimum pressures at high elevation or remote customers, fire flow requirements, available staff and SCADA capabilities.
Why measurable goals matter
If you cannot measure it, you cannot improve it. Setting clear KPIs lets you track leak frequency, minimum night flow (MNF), energy consumption, repair costs, and customer complaints before and after changes. Documenting performance with quantifiable results is the most persuasive way to convert a pilot into a system-wide program and to make the case for capital investment.
Step 2: Conduct a system assessment and baseline mapping
Once objectives are set, the next step is to assess the system in detail. This is where you gather the data that will inform valve placement, modulation strategy, and the design of a pilot.
Baseline pressure mapping
Deploy portable pressure loggers at hydrants and other strategic nodes for a minimum of one week, ideally two. Capture true pressure fluctuations across day/night cycles and weekends. You want a continuous record that shows how pressures behave at the system extremities and in suspected high-pressure zones.
Identify pressure management zones
- Map high and low pressure areas and mark critical customer locations, such as facilities that require high minimum pressures or are especially sensitive to interruptions (hospitals, industrial customers, schools).
- Consider topography and elevation: higher elevations often suffer low pressure, while low-lying areas can accumulate excessive pressure.
SCADA and data review
Review all existing SCADA data from pumps, tanks, and sensors. Is your SCADA able to accept inputs from internet-enabled sensors and communicate with electronic PRV controllers? If your SCADA is cloud-enabled and mobile-accessible, you can monitor, alarm, and adjust remotely—a major operational advantage.
Regulatory minimums and critical points
Verify compliance with regulatory pressure minimums and identify the most disadvantaged service points. These critical points will determine your minimum allowable downstream pressure and help set the safe lower limits for modulation so service is never compromised.
Step 3: Create pressure zones and place pressure regulation valves (PRVs)
Segmenting the distribution network into logical pressure management areas allows independent control of pressure. The goal is to place PRVs so they control flow into zones where pressure accumulates and to provide redundancy where needed to protect reliability.
How to divide zones
- Use topography, elevation, and system hydraulics as primary criteria.
- Where possible, make each zone controllable from a single entry or a small number of entry points. A single well-defined inlet makes pilot monitoring and troubleshooting far easier.
- Factor in major customers and fire flow locations when defining zones to ensure modulation does not impact critical demand events.
PRV placement and calibration
Install PRVs at strategic entry points to each pressure zone. In some systems you may need additional PRVs within zones to control localized pressure buildups. Calibrate the PRVs to maintain safe downstream pressures while eliminating excess pressure. Ensuring redundancy and monitoring at PRV locations is essential so that a single valve failure will not cause system-wide outages.
Protecting high-elevation and disadvantaged customers
Carefully plan for the highest elevation and most disadvantaged service points. Pressure modulation must preserve minimum service pressures to those customers. Use local pressure monitoring to validate that modulation actions do not drop pressures below regulatory or service minimums.
Step 4: Select a modulation strategy and PRV/control technology
There are multiple control approaches and varying levels of technology. Choose a strategy that fits your objectives, budget, and technical capacity. The typical progression is from fixed outlet PRVs to time-modulated, to flow-modulated, to remote closed-loop control. Each step up improves adaptability and leak reduction potential but increases complexity and cost.
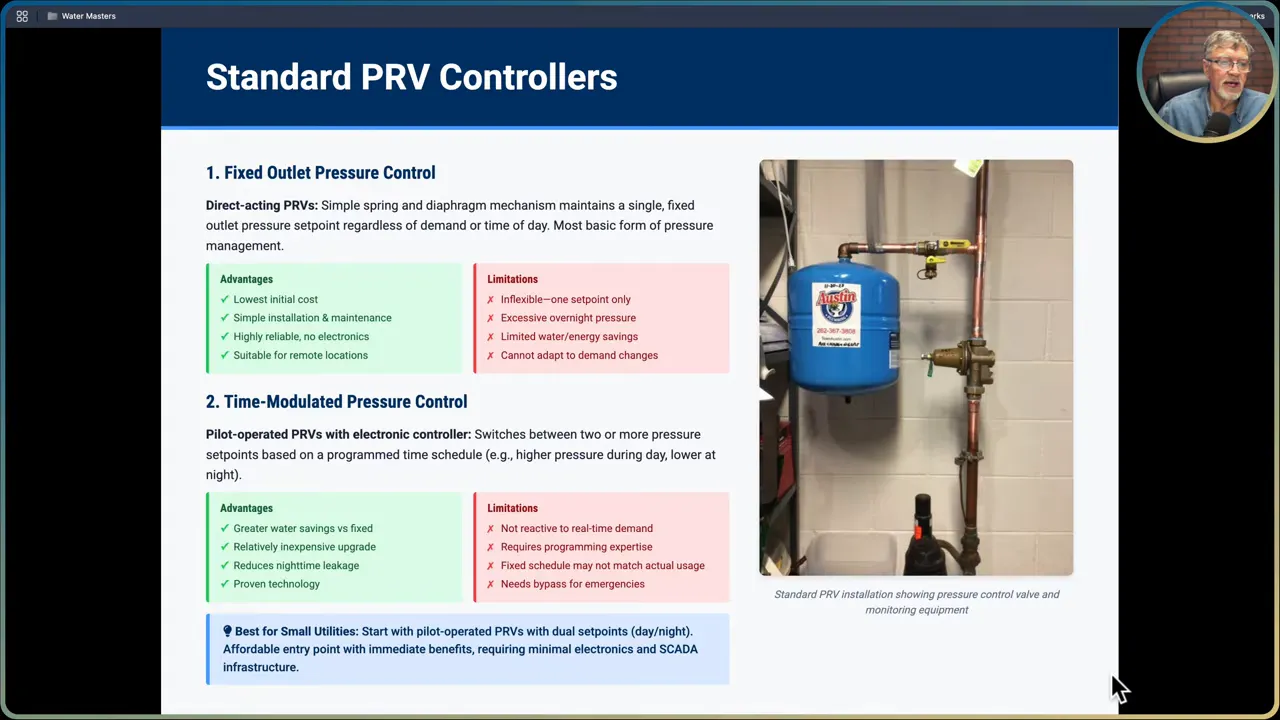
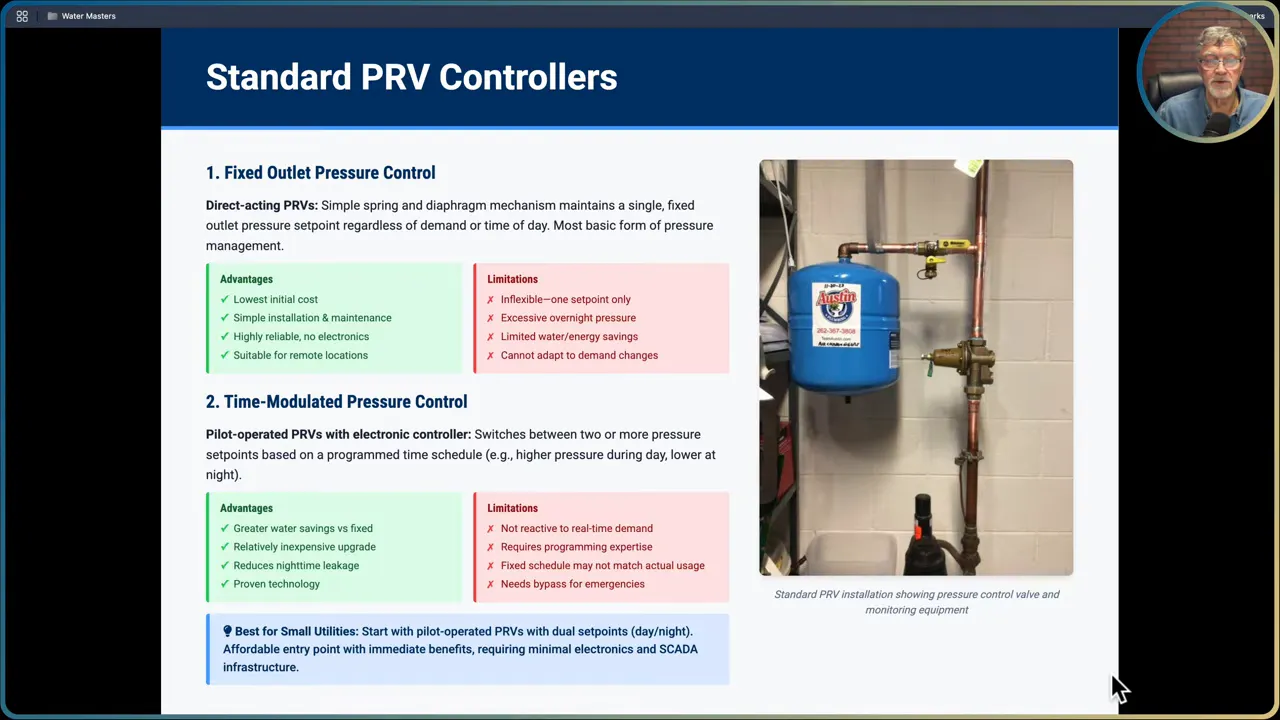
Fixed outlet PRV
A direct-acting PRV with a single fixed outlet setpoint is inexpensive and reliable. It requires minimal electronics and is suitable for remote, unmanned locations. But it is inflexible: one setpoint means daytime pressure is carried through the night, maintaining excessive nighttime pressures and limiting water and energy savings. At a minimum, this should be considered legacy baseline technology, not the target for modern pressure management.
Time-modulated PRV
Time-modulated PRVs use a pilot-operated valve with an electronic controller to switch between two or more setpoints on a schedule. This approach is inexpensive relative to more complex systems and reduces nighttime leakage by lowering pressure during off-peak hours. It will require some historical demand analysis to set appropriate switch times and may need seasonal adjustments. For most small utilities, time-modulated control is the recommended starting point for a pilot.
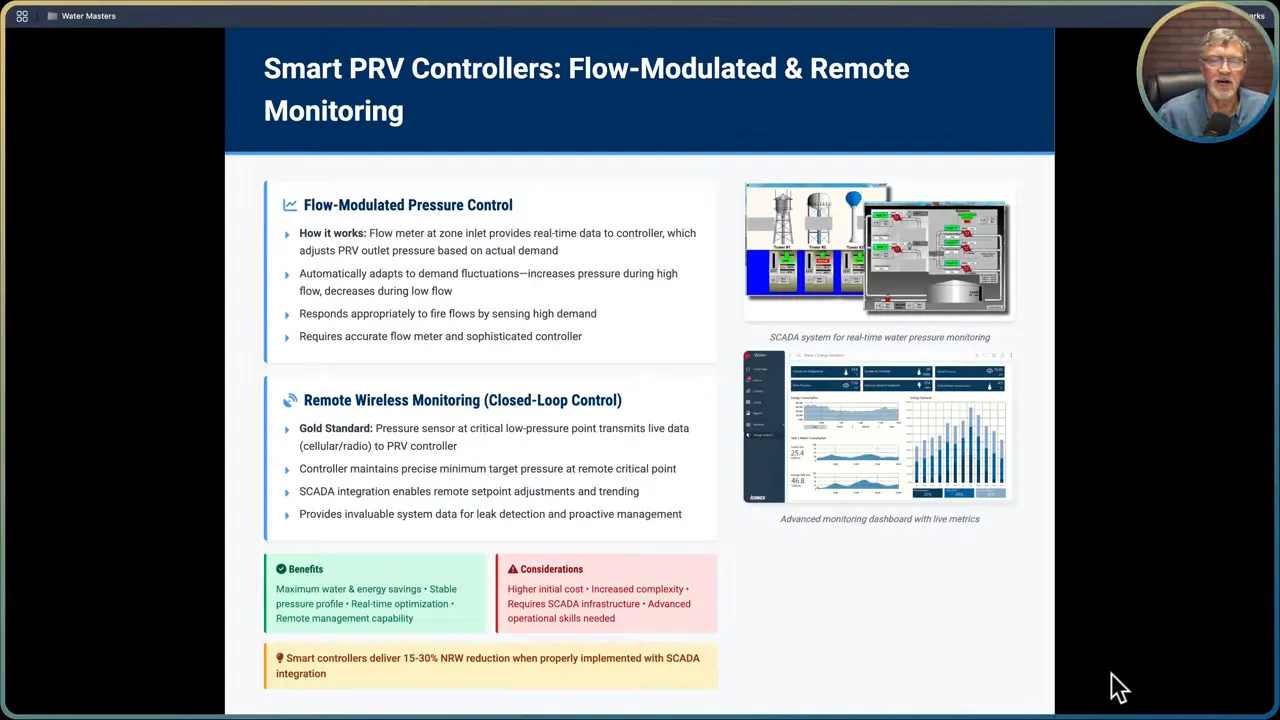
Flow-modulated PRV
Flow-modulated control ties inlet flow meter data to the PRV controller. Outlet pressure is adjusted dynamically based on actual demand. This method automatically adapts to varying demands and correctly responds to events like fire flow. It requires accurate flow metering, communications between meter and controller, and reliable power/electronics. For utilities with variable demand patterns, flow-modulated control delivers better optimization than purely time-based scheduling.
Remote wireless monitoring and closed-loop control

Closed-loop systems are the gold standard. A pressure sensor at a remote critical low-pressure point transmits real-time data to the controller via cellular, radio, or LoRa communications. The PRV controller maintains a precise minimum pressure at that remote point. Integration with SCADA allows remote setpoint changes, trending, alarm management, and advanced analytics for leak detection. Closed-loop solutions produce the highest water and energy savings and the fastest ROI, but have higher up-front costs and require SCADA integration and staff training.
Choosing the right technology
Match technology to the zone value and complexity:
- Start small with time-modulated PRVs in pilot zones that have predictable demand. They are low cost and deliver immediate benefit.
- For zones with variable demand, large customers, or fire flow requirements, consider flow-modulated PRVs.
- Use closed-loop control selectively on high-value zones or where topography creates challenging hydraulic conditions that require real-time feedback control.
Step 5: Implement data-driven monitoring and KPIs
The heart of a successful pressure modulation program is data. Real-time monitoring and trend analysis transform modulation from a one-off project into a continuous optimization system. Use data to prove value, refine setpoints, and scale with confidence.
Required KPIs
- Non-revenue water percentage before and after modulation.
- Minimum night flow (MNF) per zone or system-wide. MNF is especially sensitive to pressure changes and is a standard indicator of background leakage.
- Main break frequency and repairs per month (or breaks per mile per year).
- Energy consumption and pumping hours.
- Customer complaint volume and pressure-related service calls.
How to collect and integrate data
Use portable pressure loggers for baseline mapping and permanent pressure sensors for continuous monitoring at critical points. Tie flow meters at zone inlets to your SCADA and to PRV controllers where possible. Make sure customer service, operations, and engineering data are not siloed. Integrate complaint logs, repair records, and SCADA data into a shared database or spreadsheet so trends can be cross-referenced.
What trends reveal
Looking at trends is far more important than single snapshots. MNF trends will show whether nighttime leakage declines after modulation. If main breaks fall over successive quarters, that signals meaningful infrastructure stress reduction. Pay attention to anomalies—spikes or sudden drops in pressure or flow often reveal valve misconfigurations, a stuck actuator, or a new leak. Regular data review allows you to detect and respond to these issues before they become emergencies.
Reporting and demonstrating value
Present documented results—water saved, energy saved, fewer breaks, reduced emergency costs—to your board. Concrete ROI data turns the conversation from spending to investing. Use the pilot data to build a business case for rolling modulation to other zones.
Step 6: Continuous improvement and scale-up
Rarely does a system get everything right the first time. Build iterative review loops where SCADA trends, field crew reports, and customer feedback continually inform adjustments to setpoints, schedules, and the locations of sensors and PRVs.
Routine review cadence
- Monthly operational reviews: check alarms, trending, and immediate operational issues.
- Quarterly performance reviews: analyze KPIs, compare pre- and post-pilot metrics, and adjust modulation schedules.
- Seasonal adjustments: change setpoints for summer peak demand or winter low usage periods, and accommodate vacation/seasonal population changes.
Training and staff expertise
Invest in training for operators and managers. Understanding the control logic, how to interpret SCADA trends, and how to respond to alarms is essential. Document lessons learned from the pilot and use those to develop standard operating procedures for other zones.
Scale strategy
Prioritize additional zones for PRV installation based on pilot ROI, high-pressure problems, potential water savings, and critical customer needs. A mix-and-match approach often works best: time-modulated PRVs for predictable zones, flow-modulated for variable-demand zones, and closed-loop controllers for the most difficult hydraulic areas.
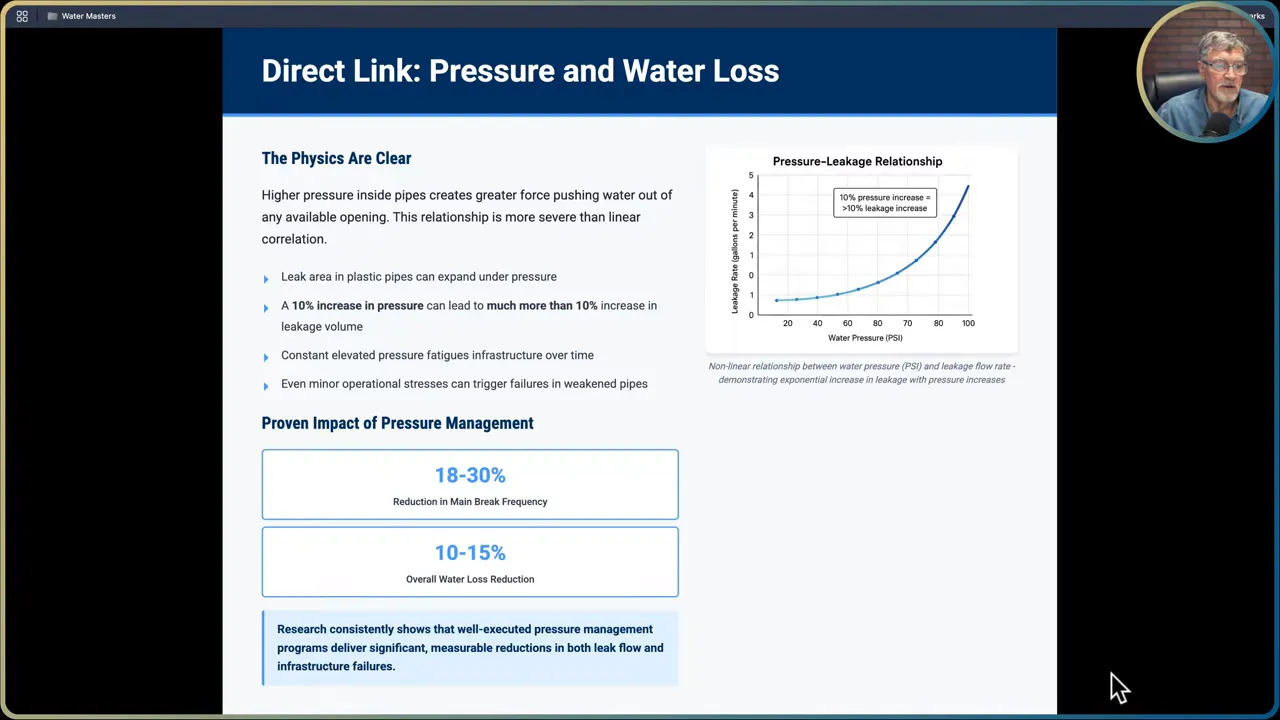
The physics: why pressure equals leakage (and why it is not linear)
At its core, the pressure-leakage relationship is simple physics. Higher internal pressures create greater force pushing water through any opening, no matter how small. But the response of leakage to pressure is not linear. Leaking plastic pipes can expand under pressure, and a 10 percent increase in pressure can produce much more than a 10 percent increase in leakage volume. That nonlinear relationship means modest reductions in operating pressure can produce disproportionately large reductions in background leakage.
Constantly elevated pressure also fatigues pipe materials, joints, and fittings. Even mild operational stress cycles—high pressure at night, slightly lower during daytime—can cause cumulative damage that turns hairline cracks into full breaks. Reducing prolonged excess pressure therefore both reduces immediate leakage and extends asset life by slowing deterioration.
Quantified benefits: what you can expect
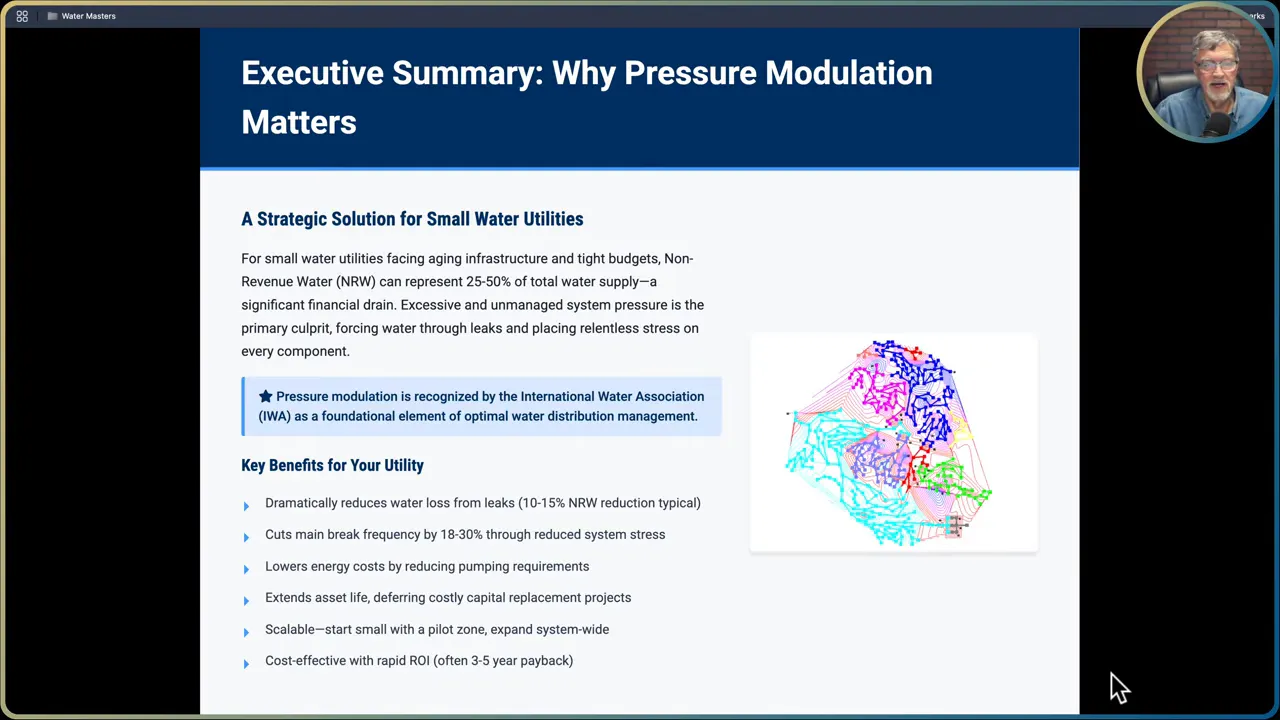
Pressure management programs that are well executed produce measurable benefits. The International Water Association recognizes pressure management as a foundational element of optimal water distribution management. Research and field experience indicate:
- 10 to 15 percent reduction in overall water loss (non-revenue water) is attainable with good control strategies.
- 18 to 30 percent reduction in main break frequency by reducing infrastructure stress.
- Energy cost savings through reduced pumping requirements and hours.
- Extended asset life, which can defer capital replacement projects by five to 15 years in some networks.
These results are not theoretical; they are measurable with sound baseline monitoring and ongoing KPI tracking. Use the data to show your board the ROI and the long-term asset life benefits that are less visible but very real.
Cost, ROI, and a simple financial case
When deciding whether to invest in pressure modulation, separate capital expenses (CAPEX) from operating savings (OPEX). Typical small utility pilot investments and annual savings look like this:
Capital expenses (typical ranges)
- PRV hardware: $3,000 to $50,000 depending on type and sophistication.
- Monitoring equipment: $500 to $3,000 per sensor or logger for pressure sensors, flow meters, and communications hardware.
- Installation costs: $5,000 to $15,000 including labor, excavation, bypasses, and commissioning.
- Typical pilot total investment: $10,000 to $25,000 for a small utility pilot zone.
Expected annual OPEX savings (illustrative)
- Water production savings from reduced non-revenue water (10–15 percent): $2,000 to $5,000 per year.
- Energy cost reductions (from less pumping): $800 to $2,000 per year.
- Repair cost savings from fewer main breaks: $1,500 to $3,000 per year.
- Total annual savings: commonly $4,300 to $10,000 for a typical small utility pilot.
Simple ROI example
Assume a $15,000 initial investment and $5,000 in annual savings. Simple payback is 15,000 divided by 5,000, which equals three years. Over a five-year window, net benefit (5,000 times 5 minus 15,000) equals $10,000. Over a 20-year asset life, cumulative returns can be significant, especially when longer-term benefits like deferred capital replacements are included.
Note that closed-loop systems often show faster paybacks, typically two to four years, because they deliver higher savings even though they cost more up-front. Time-modulated systems usually return investment in three to five years. Fixed outlet PRVs return more slowly and provide the least water and energy savings.
Phase implementation plan: a practical roadmap
Break the program into three practical phases: assess and plan; implement and monitor; optimize and expand.
Phase one: Assess and plan
- Conduct a water audit using the AWWA free water audit software to quantify non-revenue water and identify real losses.
- Deploy portable pressure data loggers at key monitoring points for at least one week to establish baseline pressure patterns and MNF.
- Map pressure zones and identify high-pressure areas and critical customers.
- Select a pilot pressure management area that is small, well-defined, and preferably has a single inlet and known high pressures.
- Establish baseline KPIs and success criteria for the pilot.
Phase two: Implement and monitor
- Install a time-modulated PRV in the pilot zone as an initial step. Time-modulated controllers are cost effective and deliver immediate results.
- Ensure proper valve sizing, bypass provisions, and correct installation practices.
- Continue monitoring flow and pressure data; focus on MNF reduction, leak repair records, and customer feedback.
- Document operational changes and lessons learned to reduce knowledge loss and accelerate future rollouts.
Phase three: Optimize and scale
- Use pilot data to calculate water, energy, and cost savings and to build a business case with a clear payback period.
- Present results to the board and make the case for expanding modulation across prioritized zones.
- Prioritize additional PRV installations based on expected ROI, pressure problems, and critical customer locations. Consider using more advanced controllers (flow-modulated or closed-loop) for complex zones.
- Develop a system-wide pressure management strategy and iterate with routine reviews and seasonal fine-tuning.
Operational guidance: practical tips and common pitfalls
Start with a pilot
Always start small. A single pilot zone lets you work out hardware sizing, control logic, time schedules, or flow thresholds before committing to system-wide changes. Pilots reduce risk and produce the data that turns curious boards into supporters.
Tune schedules seasonally
Time-based controllers must be tuned for seasonal usage. Summer peaks and winter lows require different schedules. If your service area has many vacation homes or large seasonal inflows, factor seasonal variability into your modulation logic.
Plan for emergencies and bypasses
All control strategies must have clear fail-safe protocols and bypass options. A valve actuator failure or communication outage should not cause low-pressure events for customers. Always include manual bypass capabilities and emergency setpoints in your SOPs.
Mind communications and cybersecurity
With IoT devices and SCADA integration comes a need to secure communication channels. Use secure, authenticated communications and keep firmware up to date. Consider cellular or LoRaWAN connections for remote sensors and ensure your SCADA vendor follows security best practices.
Integrate customer data
Customer complaints about pressure are valuable inputs. Integrate complaint logs with operational data to identify zone-specific issues and to verify that modulation actions do not produce service complaints. This cross-disciplinary integration will uncover root causes faster.
Beware of data silos
Data that lives in separate spreadsheets or departments is much less useful. Create shared access to KPIs so operations, engineering, and management base decisions on the same evidence.
Resources, funding, and technical assistance
Several resources exist to help small utilities implement pressure modulation:
- EPA water technical assistance and state technical assistance programs.
- Rural water associations and circuit riders for hands-on engineering support.
- Funding opportunities: USDA Rural Development, state revolving funds, and other grants or loans for small utilities.
- American Water Works Association (AWWA) resources, including the free water audit software, and regional AWWA sections for local networking and best-practice sharing.
Leverage these resources to find funding help, engineering guidance, or peer-to-peer knowledge exchange. Many utilities successfully start pilots using a mix of internal funds, grants, and technical assistance.
Measuring success: what to report to your board
When you present results, emphasize the hard numbers and the strategic value. Boards respond to documented savings and clear payback timelines. Include these elements in your report:
- Before-and-after non-revenue water percentage and the absolute volume saved.
- MNF changes in liters per second or gallons per minute, per zone.
- Main break frequency and repair cost trends over successive quarters.
- Energy savings and pumping hour reductions.
- Projected deferred capital replacement amount and years deferred.
- Simple payback calculation and net present value over a reasonable planning horizon (10 to 20 years).
If the pilot demonstrates 10 to 15 percent water savings and a three-year payback, you have a compelling case to scale. Use visuals of trend lines and a simple ROI table to make the data digestible for non-technical board members.
Case study scenarios and example calculations
Here are two short hypothetical scenarios that illustrate the business case modeling you can use.
Scenario A: Small utility pilot
- Population served: 2,500
- Current non-revenue water: 25 percent
- Average annual water production cost: $50,000
- Goal: reduce NRW to 12 percent (approx 13 percentage point reduction)
- Pilot investment (time-modulated PRV, sensors, installation): $15,000
- Estimated annual savings: $5,000 (water + energy + fewer repairs)
Payback is 3 years. Over a 20-year horizon, the cumulative savings net of the pilot cost is substantial, and the pilot also demonstrates deferred capital replacement benefits as main breaks decline.
Scenario B: Medium complexity zone with closed-loop
- Population served in zone: 8,000
- Complex topography with several high and low points
- Investment in closed-loop control: $50,000 for sensors, communications, PRV controllers, and SCADA integration
- Estimated annual savings: $17,500 (higher due to larger volumes and better optimization)
Simple payback is under three years. If closed-loop control reduces main breaks by 20 percent and defers a capital replacement of a feeder main by five years, the strategic savings are even larger than the initial ROI indicates.
Common questions and answers
Will lowering pressure cause low-pressure complaints?
Not if you plan and monitor properly. Define the minimum acceptable pressures at critical service points and set PRV lower limits accordingly. Use remote pressure monitoring to validate that customers are not adversely affected and to adjust setpoints if necessary.
How often should PRV settings be adjusted?
At a minimum, establish seasonal reviews and monthly or quarterly performance checks. For time-modulated systems, update schedules seasonally or after major usage pattern changes. For flow-modulated and closed-loop systems, automatic adjustments happen continuously, but operators should still review trends weekly to monthly.
What happens during fire flow events?
Flow-modulated and closed-loop controllers are designed to sense high demand events and increase pressure as needed to meet fire flows. Time-modulated systems must be set with sufficient daytime pressure margins to accommodate emergency demands.
Do I need full SCADA to start?
No. A pilot can start with portable loggers and a time-modulated PRV without full SCADA integration. However, SCADA greatly improves monitoring, alarm management, and remote control, and it becomes essential as you move to flow-modulated or closed-loop control.
Final checklist: immediate action items
- Perform a water audit using the AWWA free water audit software to quantify current non-revenue water.
- Deploy pressure loggers at key locations for at least one week to establish baseline pressure and MNF.
- Select a pilot zone that is small, has high pressure, and preferably a single inlet.
- Install a time-modulated PRV in the pilot zone as the least-cost, highest-impact first step.
- Integrate pressure and flow measurements into your regular data review and track KPIs.
- Document pilot results and prepare an ROI presentation for your board for scaling decisions.
Conclusion: why start now
Pressure modulation is low-hanging fruit for small water utilities. It is cost-effective, scalable, and measurable. By lowering excess pressure during off-peak periods and using data to guide continuous adjustments, you can reduce non-revenue water, lower energy bills, reduce main breaks, extend the life of your distribution assets, and improve customer service reliability.
Start with a clear objective, gather baseline data, pilot an inexpensive time-modulated PRV in a single zone, and use the results to expand strategically. With good monitoring and a disciplined review process, pressure modulation will move your utility from reactive crisis management toward proactive and predictive stewardship of your water resources.
If you follow the step-by-step approach outlined here, you will achieve measurable results and a solid business case for further investments. Pressure modulation is an investment that pays for itself and helps preserve the most essential asset of your utility: reliable, safe water service for your community.