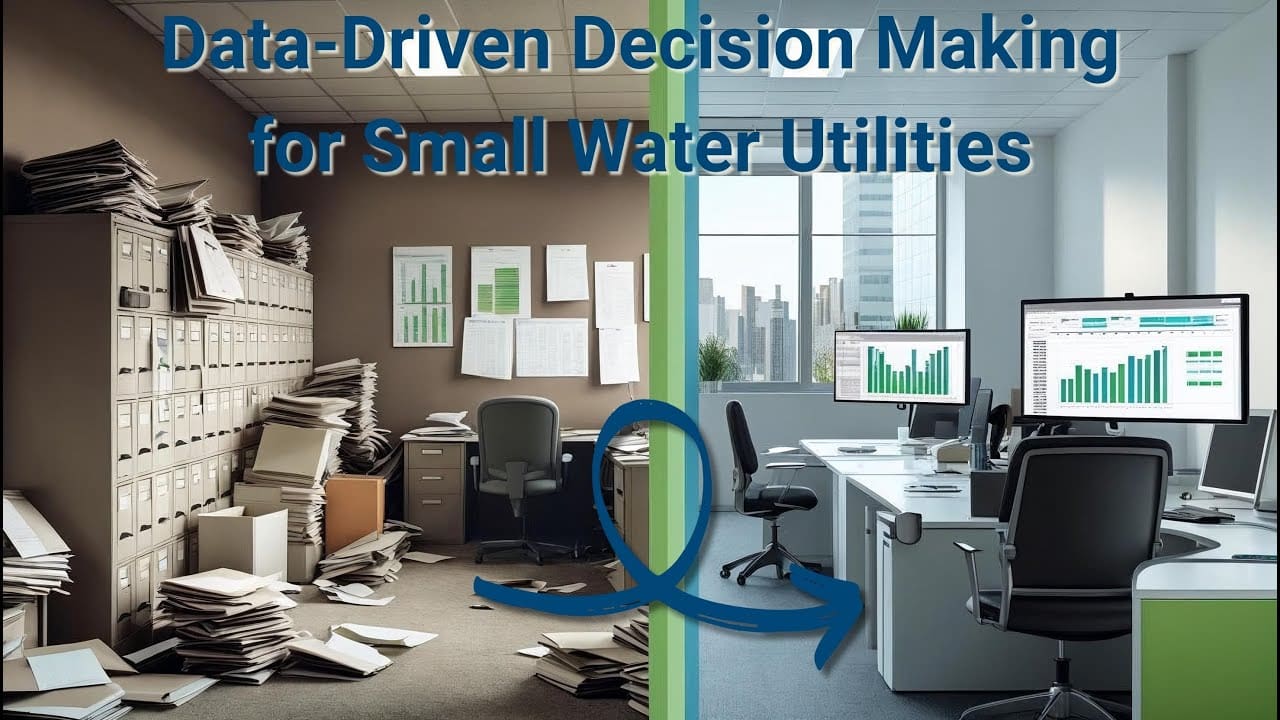
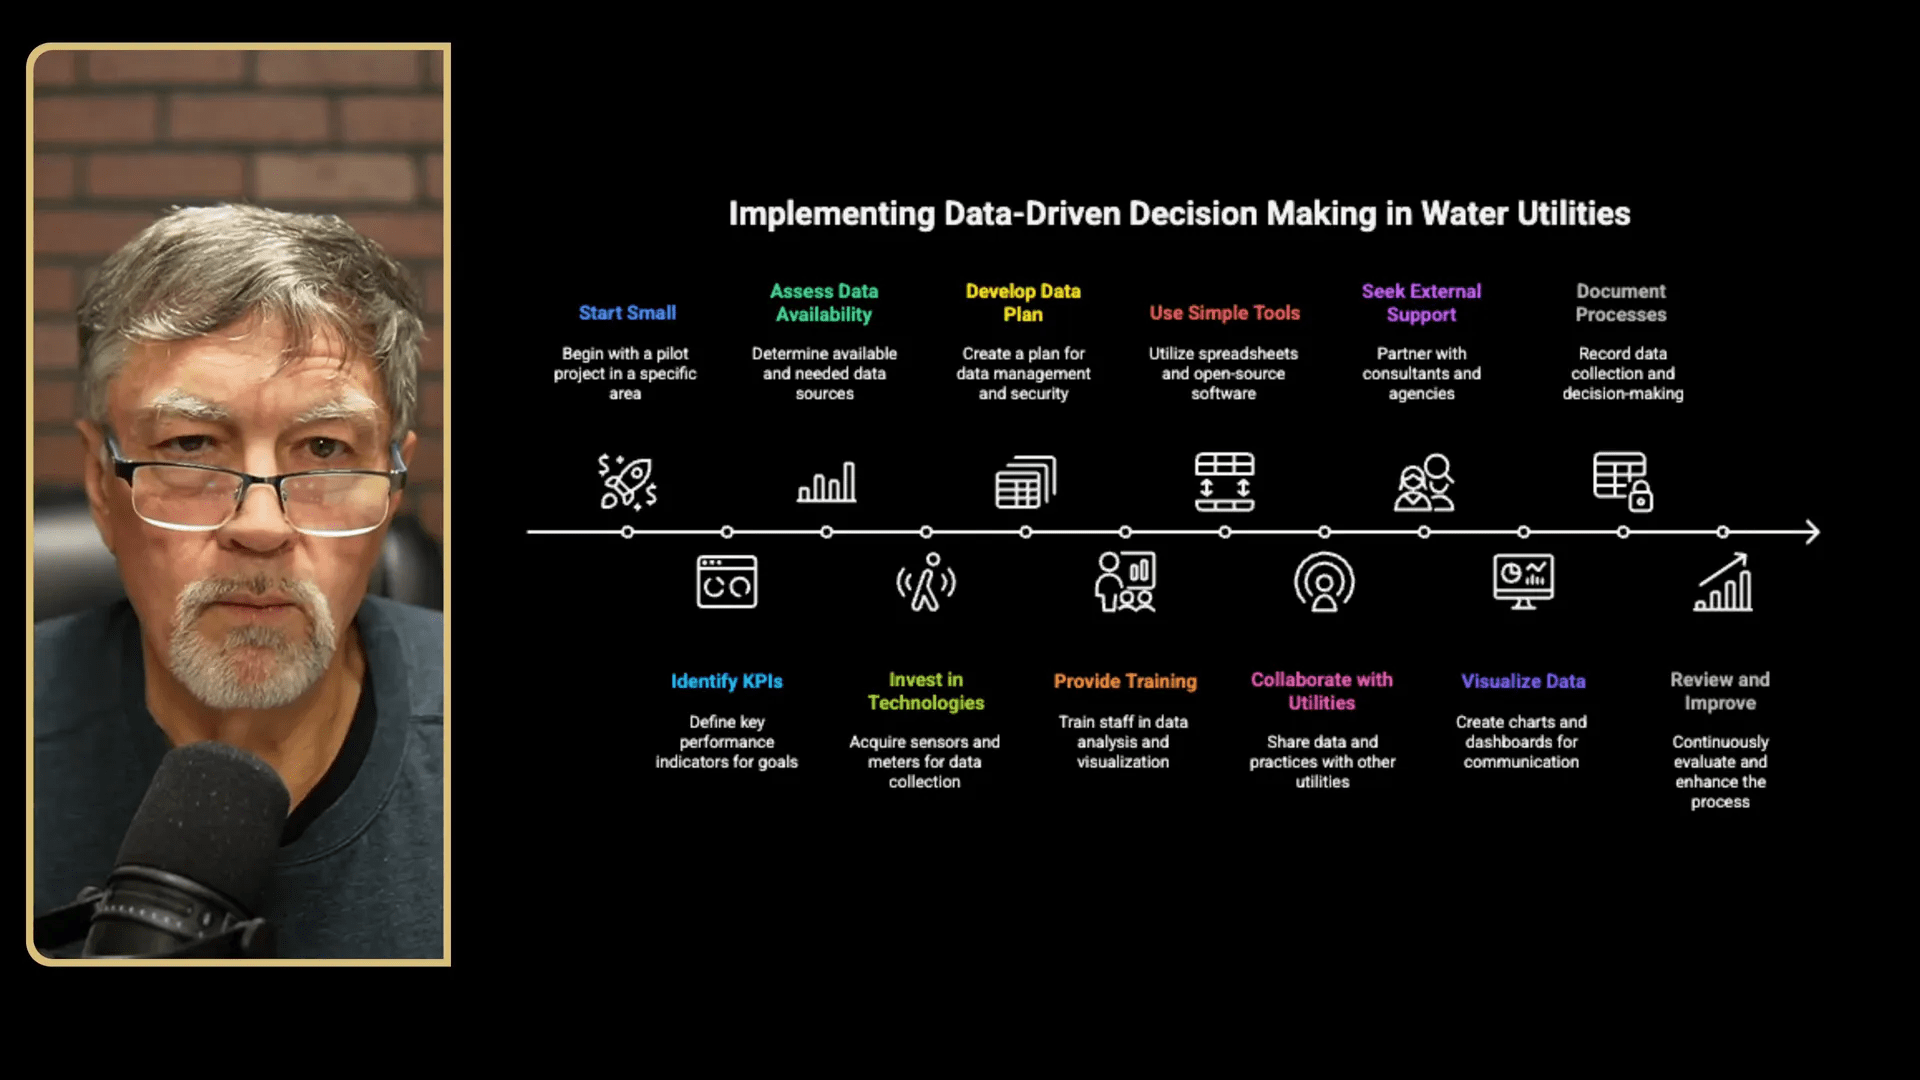
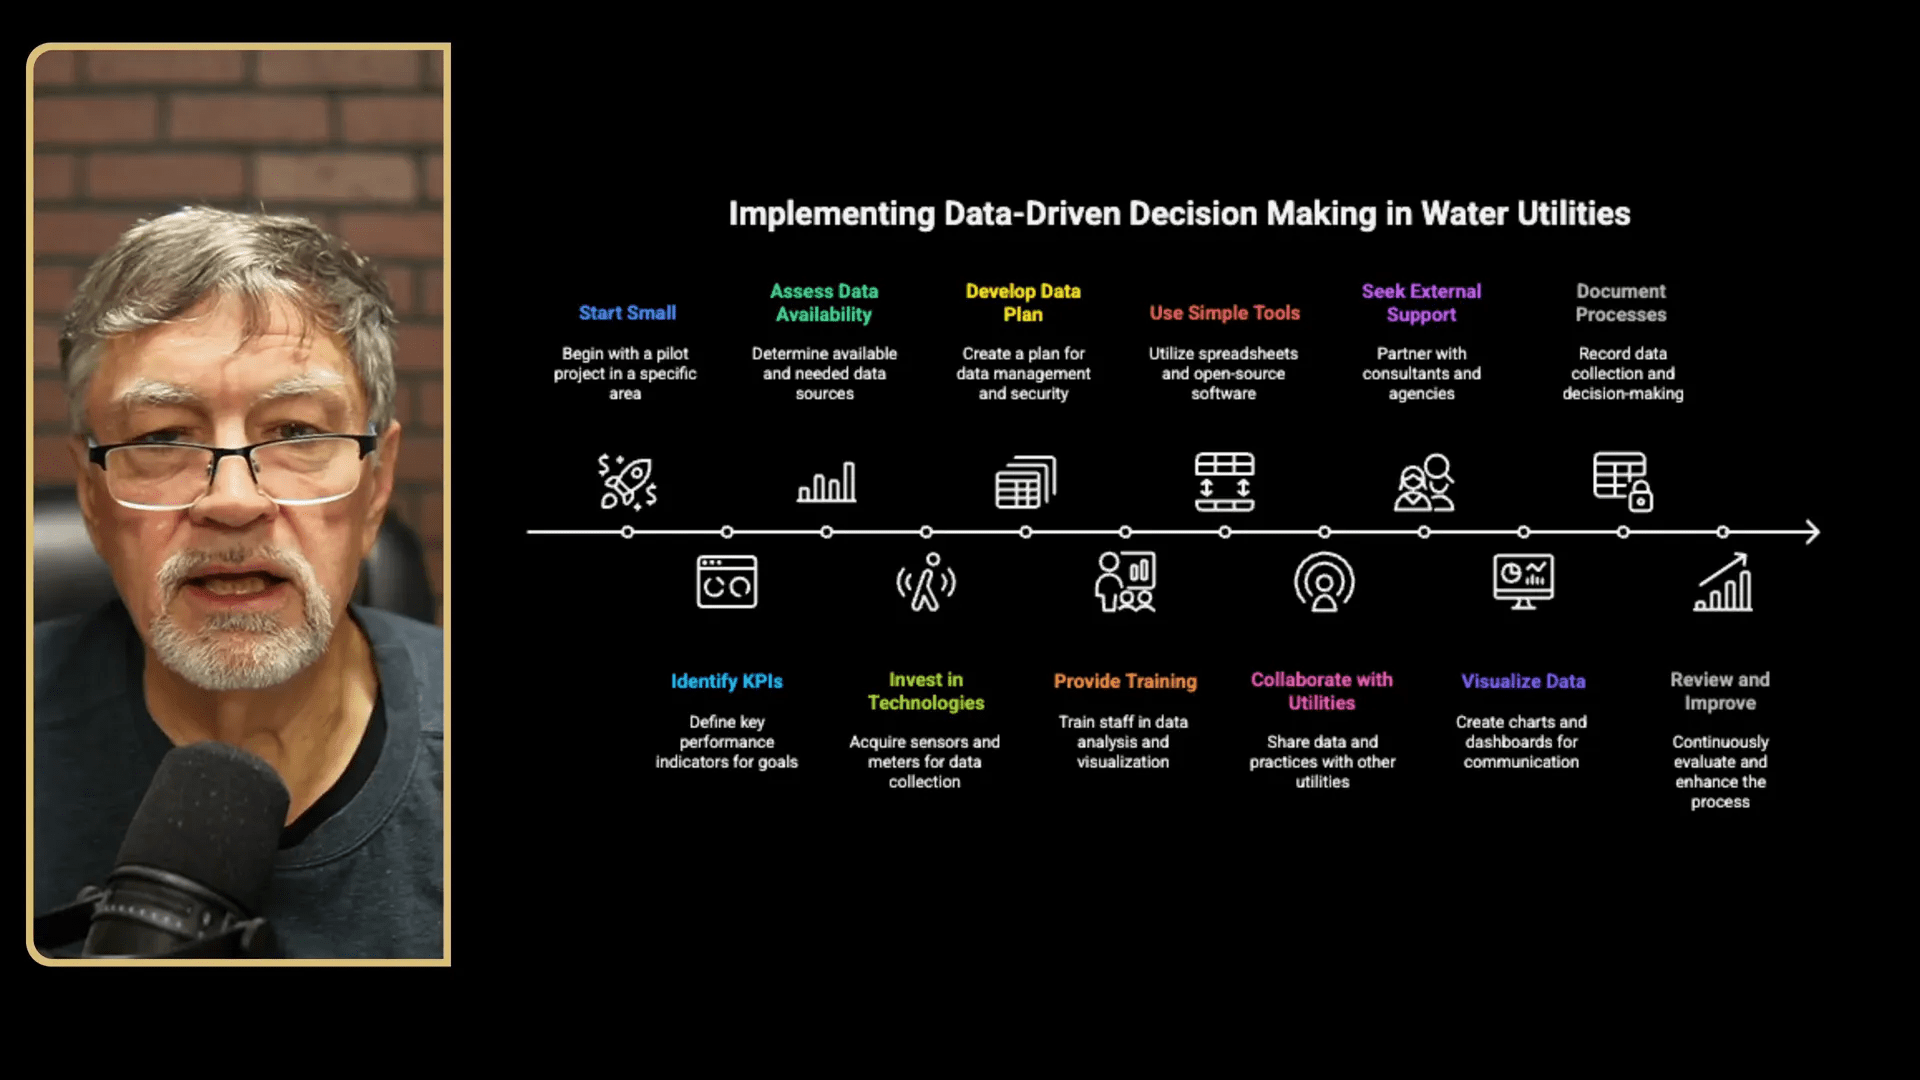
This guide is adapted from a video by Tom Ballard (The Groundwater Guy) and is written so operators, managers, and board members of small water utilities can take immediate, practical steps to implement data-driven decision making across our systems. Data-driven decision making is more than a buzzword; it’s a systematic approach that turns the routine information we already collect into daily operational advantage. In this article we will walk through a step-by-step implementation roadmap, practical examples, tools that work for small budgets, common pitfalls, and a realistic plan for getting started.

Step 1: Understand what data-driven decision making means for us
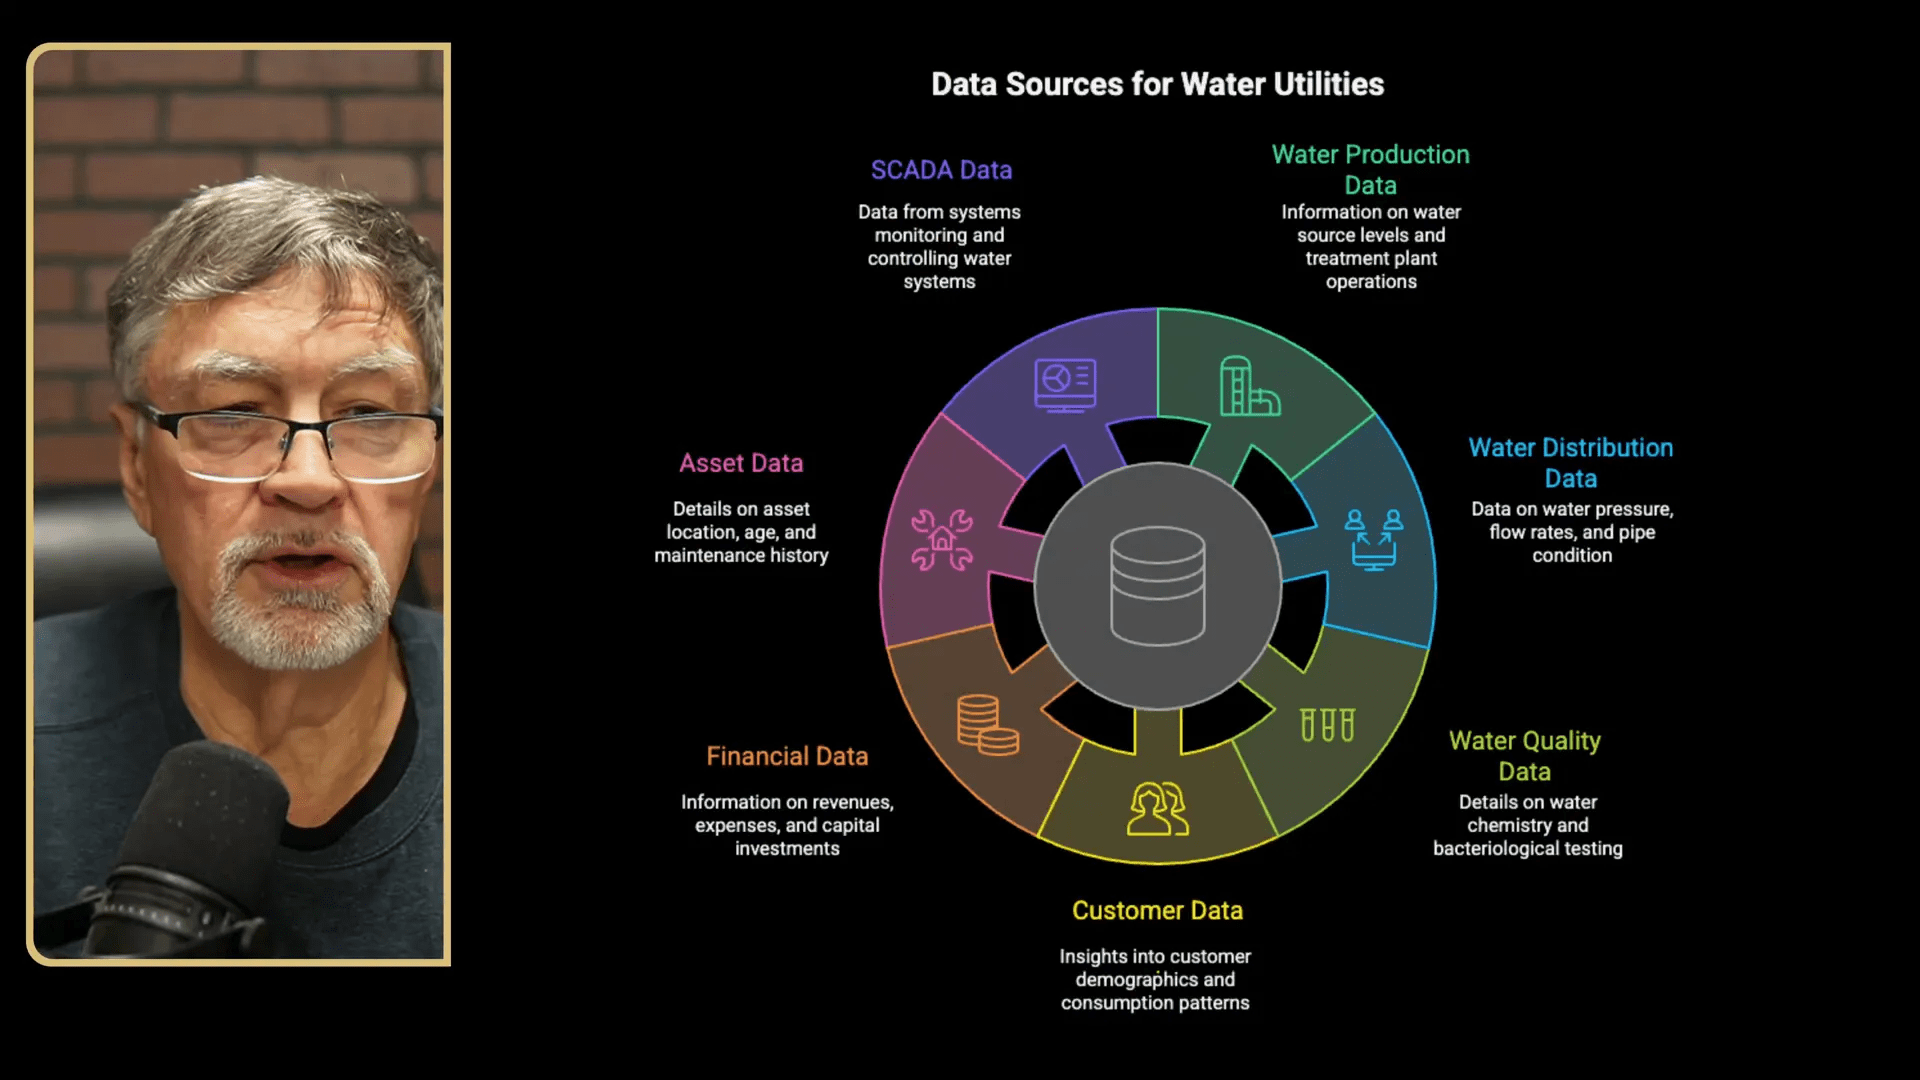
Data-driven decision making (DDDM) means making choices based on verifiable measurements and trends rather than on memory, gut feeling, or isolated reports. In our world, we already generate a torrent of data: SCADA logs, lab reports, billing records, customer service calls, asset inventories, pressure and flow readings, and more. Too often, that data ends up filed in paper cabinets or buried in separate digital silos. With a focused data-driven decision making approach we take those fragments and convert them into actionable trends and predictable outcomes.
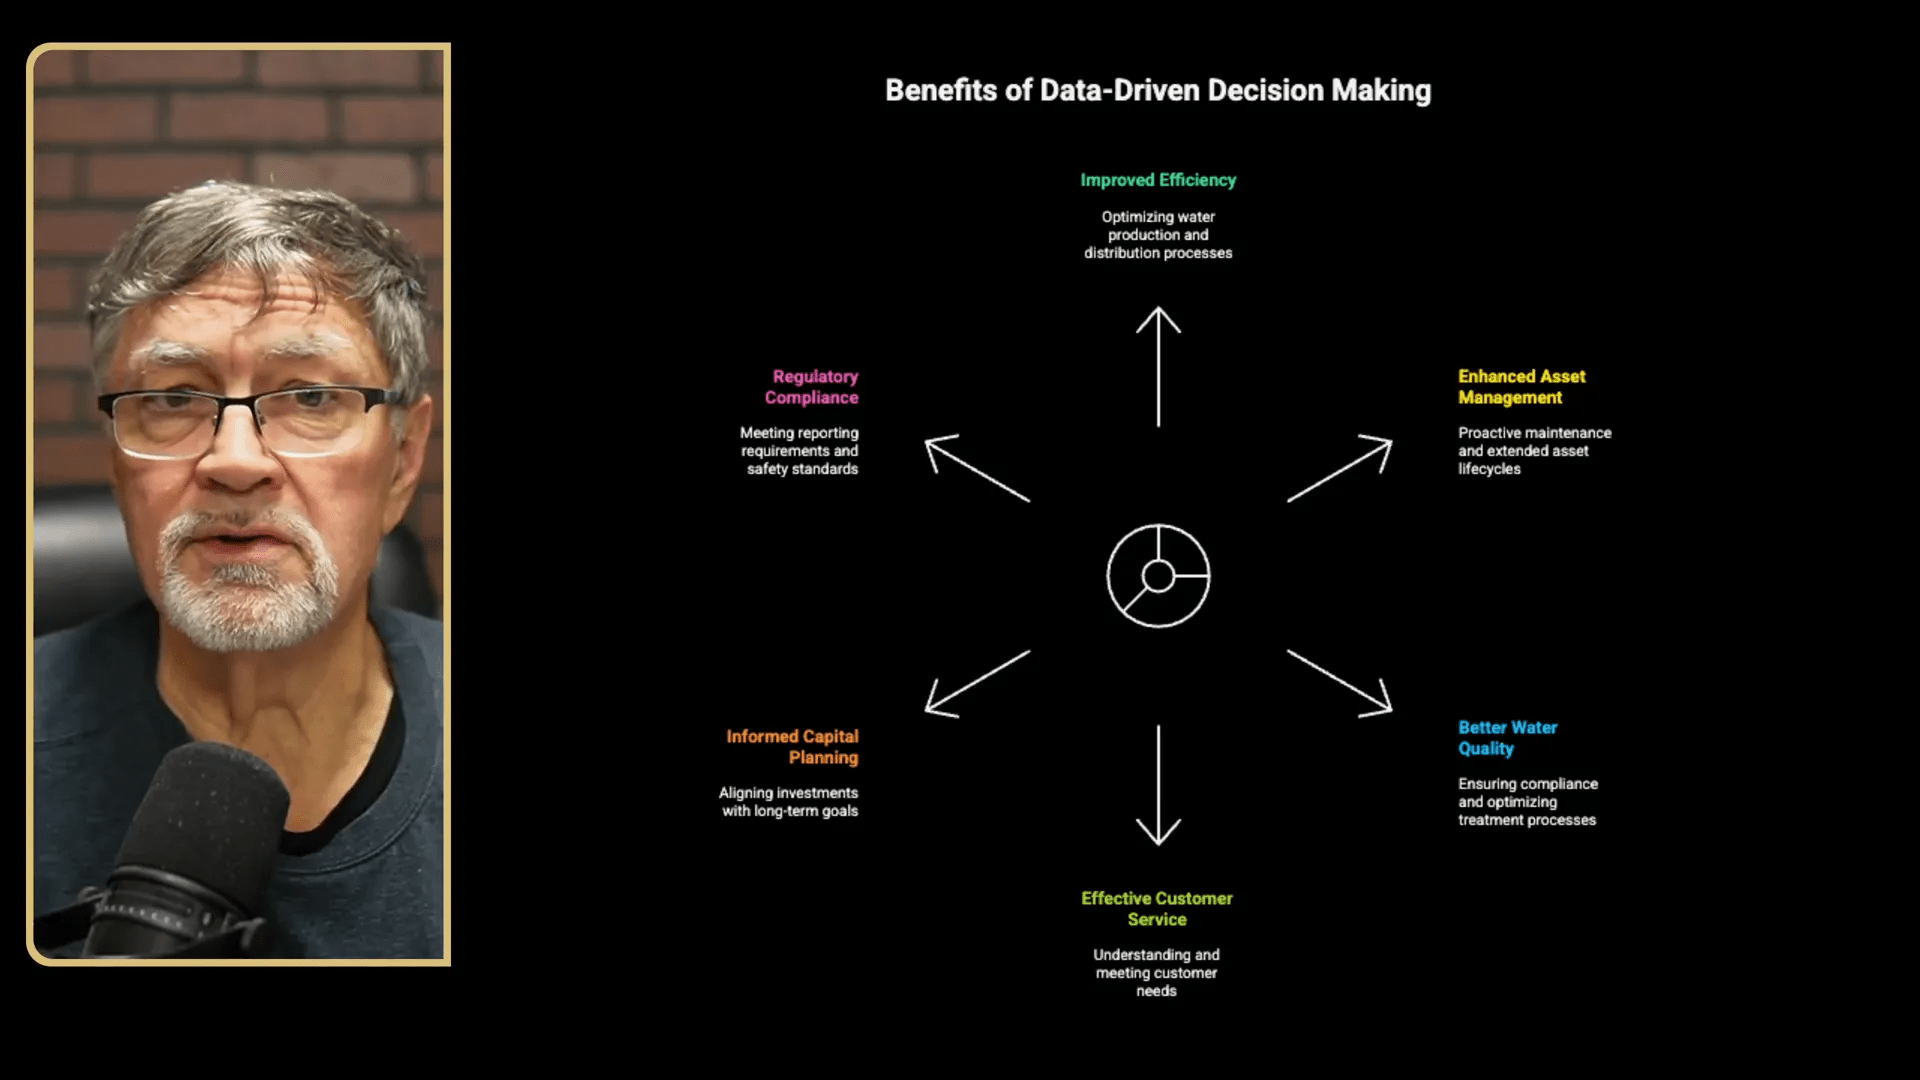
Why does data-driven decision making matter? Because small water utilities can realize improved efficiency, better asset life cycle management, higher and more consistent water quality, smarter capital allocation, and improved customer service — all by using the information we already collect more intelligently. The cost of entry has fallen considerably, so we can implement practical data-driven decision making without huge capital outlays.
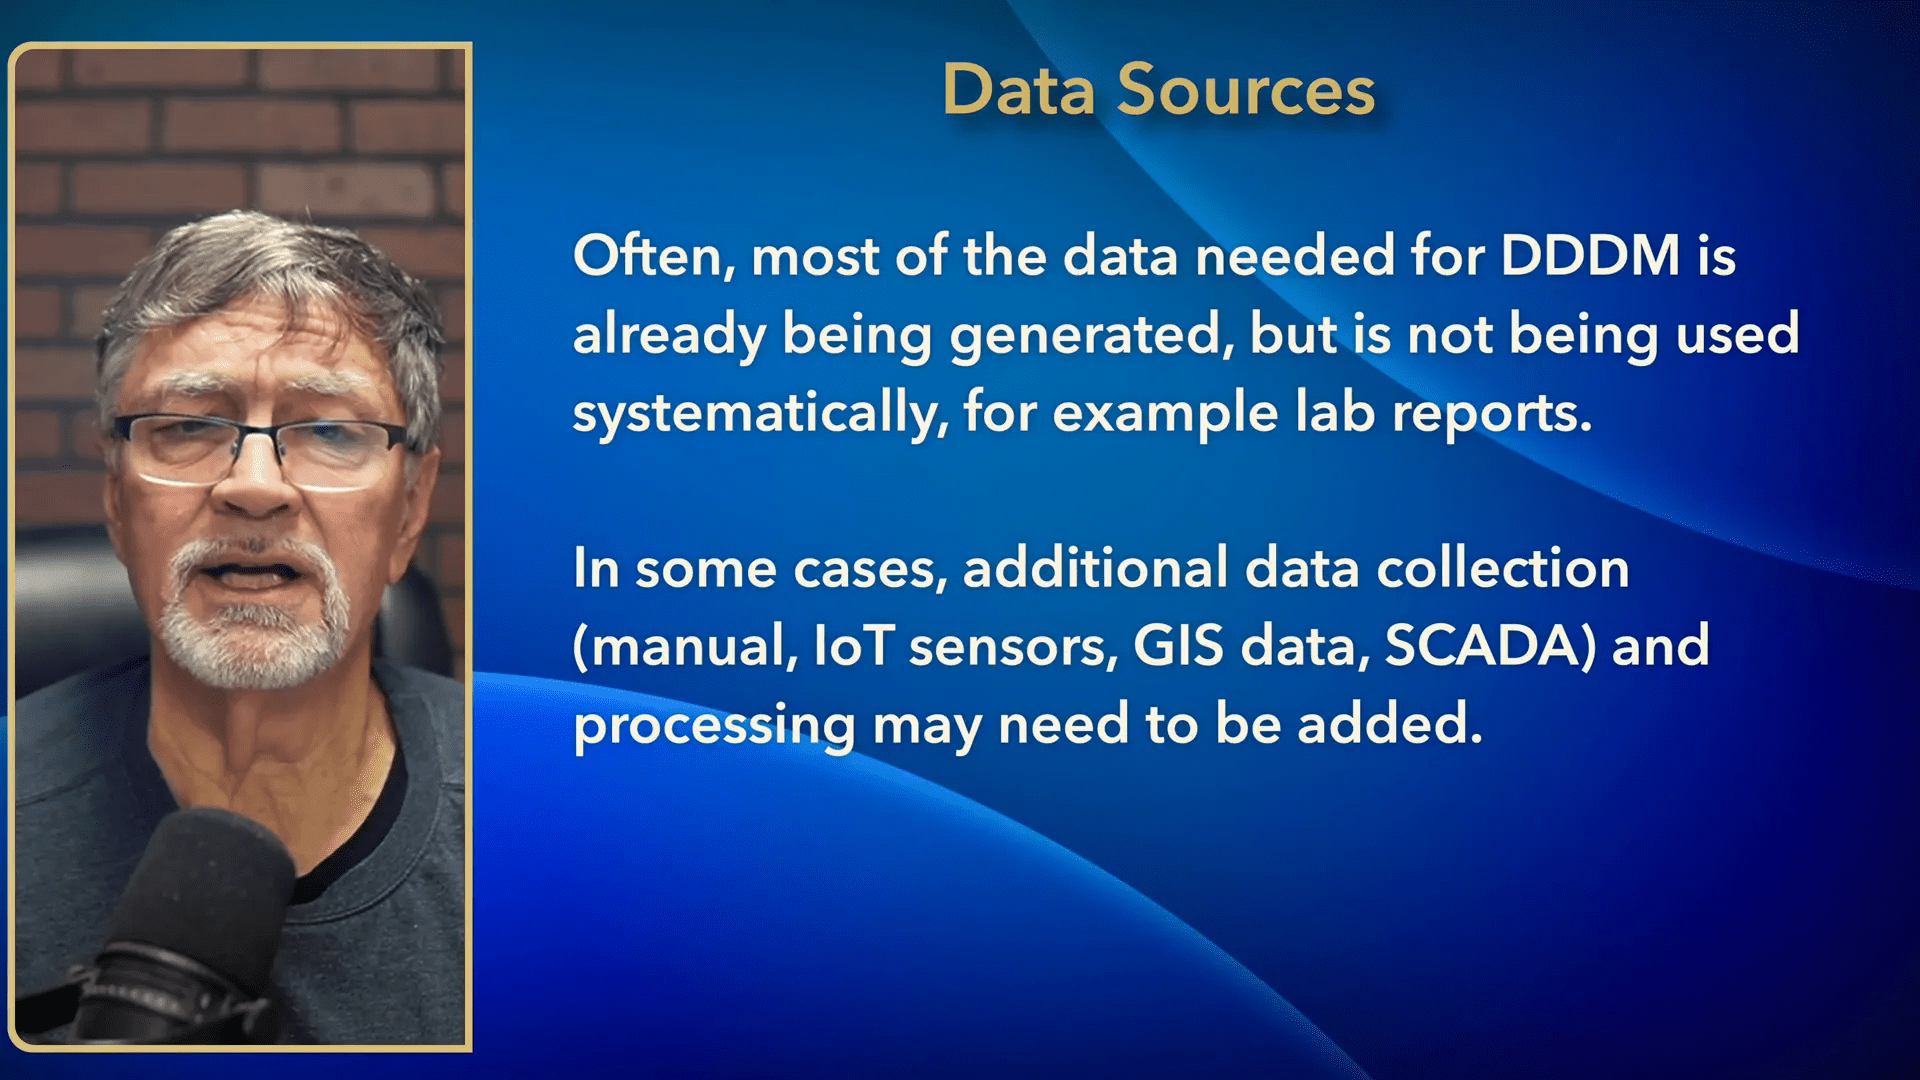
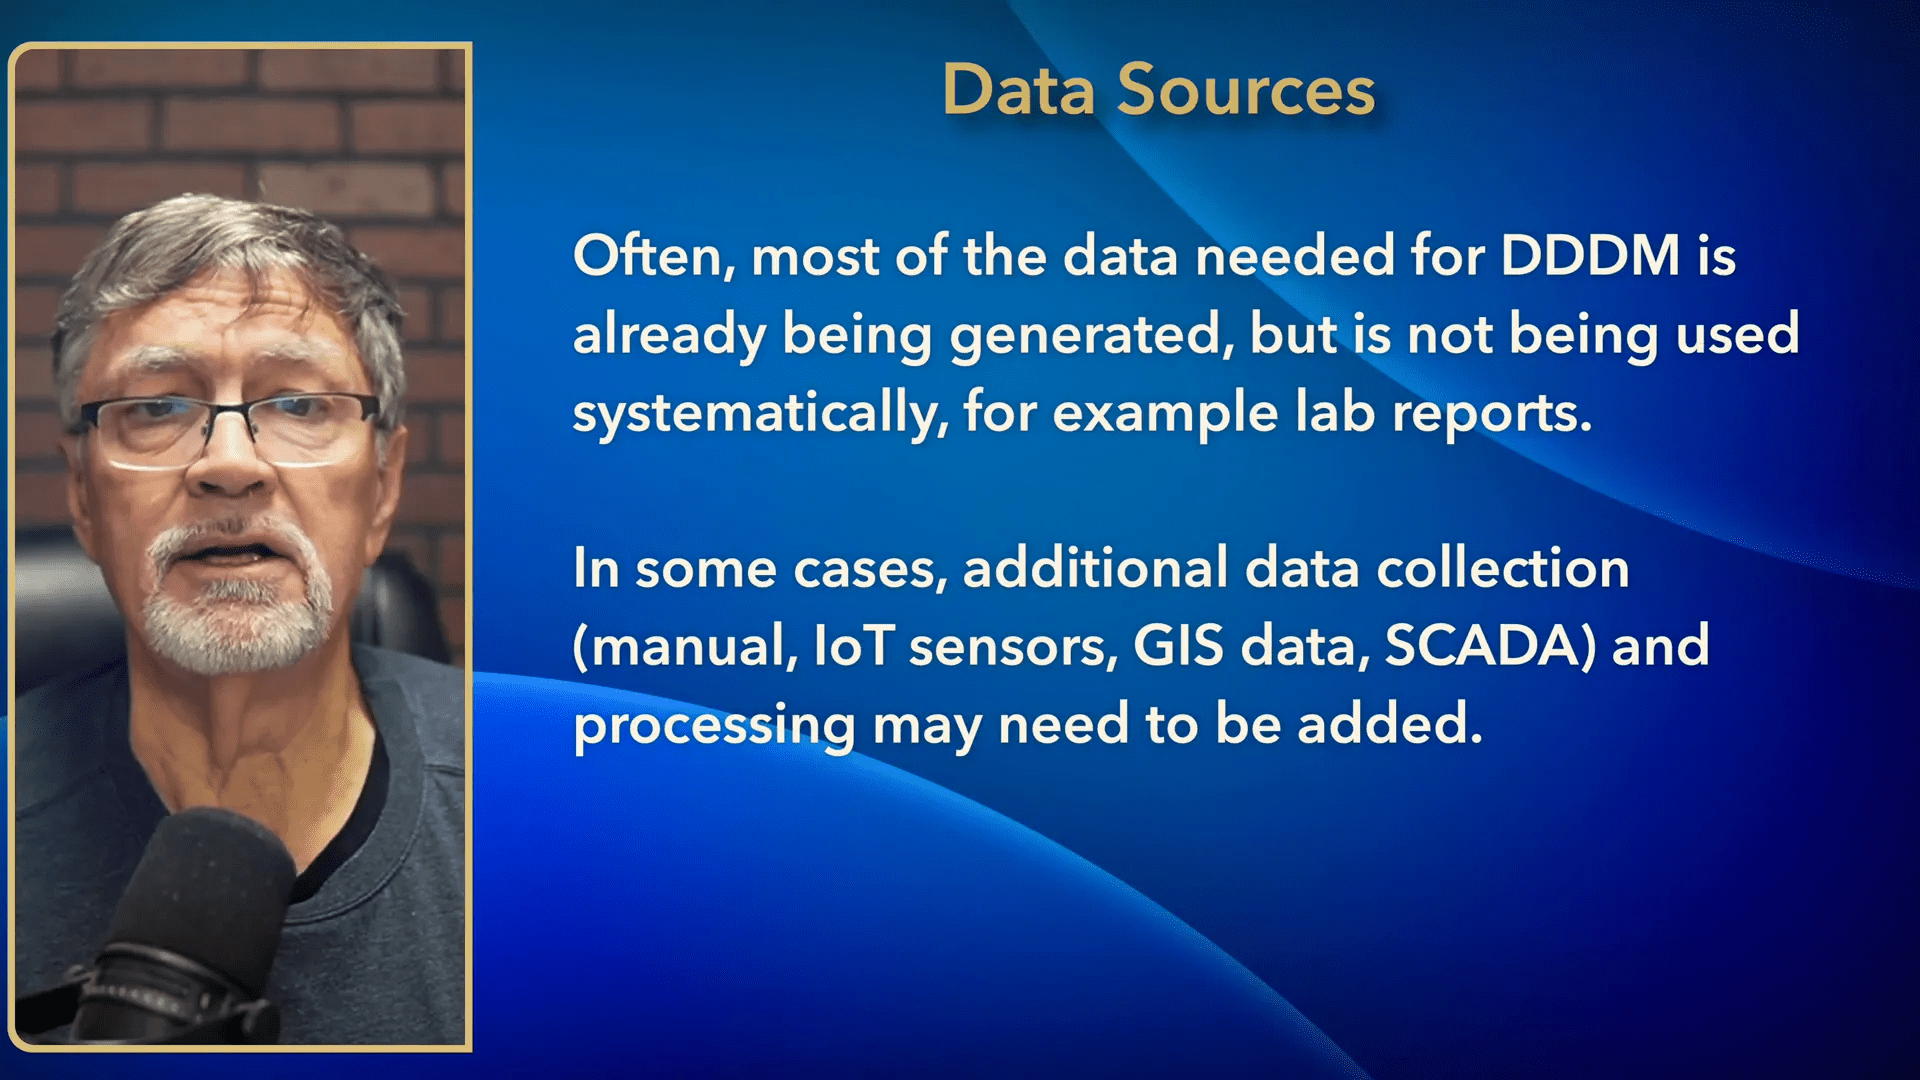
Step 2: Identify the data sources we already have
Before investing in new technology, we need to catalog the data sources that already exist in our utility. Typical sources include:
- SCADA logs (pump runtimes, tank levels, pressures)
- Lab reports (bacteriological, chemical, residual disinfectant)
- Water production and consumption records
- Meter reads and billing data
- Customer service requests and complaint records
- Asset inventories, maintenance logs, and GIS locations
- Financial records (revenues, expenses, capital projects)
Most of these data streams are already being generated. The missing piece is centralizing them so we can analyze trends — not just spot-check a single report. That shift from isolated checks to continuous trend analysis is the heart of data-driven decision making.
Step 3: Define our goals and KPIs
Data-driven decision making only works when we know what we are trying to measure. Key Performance Indicators (KPIs) give us targets and a common language for assessing progress. Start by selecting a small set of high-impact KPIs that are easy to measure and meaningful to daily operations and long-term planning. Examples:
- Non-revenue water percentage (water loss)
- Number of pressure complaints per 1,000 connections
- Pump runtime hours vs. production volume (pump efficiency)
- Average chlorine residual in distribution zones
- Percent of assets with up-to-date maintenance records
- Planned vs. emergency maintenance ratio
We should embed these KPIs into our reporting cadence — weekly dashboards for operations, monthly for management, and quarterly for the board. These KPIs are the measuring sticks for our data-driven decision making efforts.
Step 4: Assess data availability and plug the gaps
With KPIs in place, we audit whether the data needed to compute them is being collected, is reliable, and is accessible. Many utilities find data silos: lab reports in PDFs on someone’s desk, meter records in a different system, SCADA archived separately. Data-driven decision making requires addressing those gaps.
We take inventory: which KPI fields are fully available? Which need regular manual entry? Which are missing entirely? For gaps that require new measurement, prioritize additions that produce the biggest KPI improvement for the least cost.
Step 5: Invest in affordable technologies, starting small
We do not need enterprise software to start data-driven decision making. For small utilities, inexpensive and even free tools can produce large gains. Practical technology steps:
- Use spreadsheets (Google Sheets or Excel) as the initial data consolidation platform.
- Connect SCADA exports to spreadsheets or a simple database for automated ingestion.
- Add targeted IoT sensors to critical assets (pressure, flow, level, vibration) where manual data is insufficient.
- Use GIS to record exact asset locations and attach photos and maintenance history.
Because SCADA systems increasingly have cloud-compatible exports, they can serve as hubs for a low-cost data pipeline. We can automate periodic dumps from SCADA into a centralized spreadsheet or database, enabling near-real-time tracking for our KPIs. That is practical, low-cost data-driven decision making in action.
Step 6: Pilot a focused project
We start data-driven decision making with a pilot. Pick a single problem area that is important, measurable, and feasible: leak detection in one pressure zone, pump optimization at one well, or water quality trending at a treatment plant. A pilot helps us work out data flows, reporting, staff responsibilities, and cybersecurity considerations before scaling.
A pilot should include a short timeline (60–90 days), clear KPIs tied to the pilot, and a simple visualization/dashboard that the team reviews regularly. Use the pilot to get staff familiar with the tools and to demonstrate quick wins to the board.
Step 7: Create a data plan and address cybersecurity
Data-driven decision making without a data plan invites chaos and risk. Our data plan should define:
- Where data is stored and how it is backed up
- Who is responsible for data entry, validation, and reporting
- Retention schedules for records and lab reports
- Access controls and user permissions
- Cybersecurity practices and incident response
Small utilities are not immune to cyber threats. Most successful attacks exploit weak passwords or social engineering. As part of our data plan we implement basic cybersecurity hygiene: unique passwords, multi-factor authentication where feasible, regular updates for cloud and local systems, and staff training to avoid phishing attacks. Making cybersecurity part of our data-driven decision making program ensures we maintain data integrity and continuous operations.
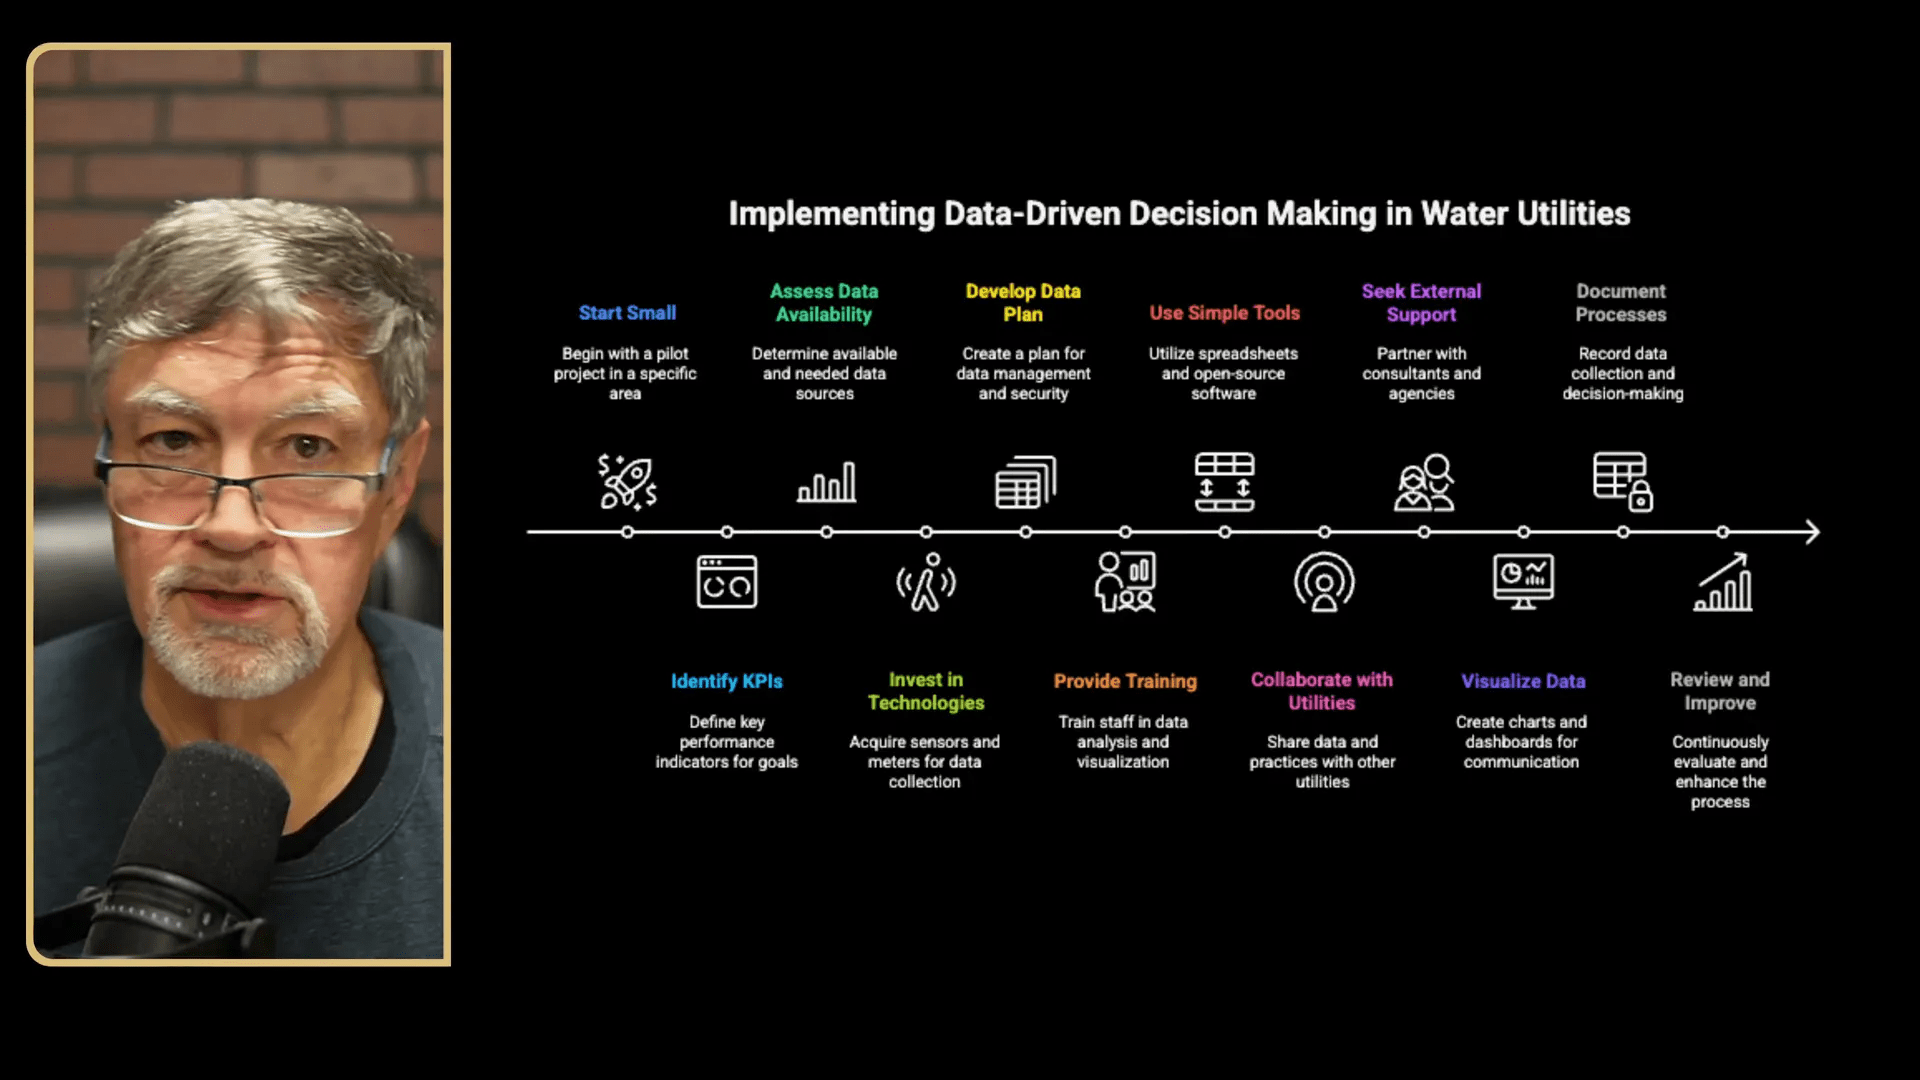
Step 8: Train staff and document processes
People make the systems workable. We must invest in training so staff can collect, interpret, and act on data. Training objectives should include:
- How to enter and verify data consistently
- How to interpret KPI dashboards and basic charts
- How to use simple AI tools for generating visualizations and summaries
- How to follow SOPs for automated alerts and escalations
We also create Standard Operating Procedures (SOPs) that describe data collection steps, quality checks, escalation triggers, and decision authority. SOPs help new staff get up to speed quickly and ensure that data-driven decision making remains reliable and repeatable.
Step 9: Use simple tools and AI to visualize trends
Visualization turns numbers into insight. The human brain reads charts faster than tables. For small utilities, simple charts in Google Sheets or Excel paired with short narrative summaries are often enough to inform decisions. We can accelerate analysis with basic AI tools (for example, Google’s Gemini within Google Sheets or other built-in assistants) to produce charts and short analytical notes from our data.
Ask the AI to compare runs of a pump vs. energy consumption, to flag increasing arsenic trends, or to highlight zones with repeated pressure complaints. This frees staff from tedious analyses and lets them focus on fixing the problem. Visual dashboards should be accessible to operations staff, managers, and board members, each with the level of detail appropriate for their roles.
Step 10: Collaborate with neighboring utilities and seek external support
We don’t have to reinvent the wheel. Partnering with nearby utilities, trade associations, and regulatory agencies helps us accelerate data-driven decision making. Consider:
- Forming a local mastermind group to trade best practices and lessons learned
- Sharing vendor experiences and sensor deployments that worked at a low cost
- Engaging consultants for short, targeted help when we need expertise (cybersecurity, GIS mapping, or predictive maintenance modeling)
- Keeping regulators informed about our implementation, which builds goodwill during the transition
Sharing insight and pooled purchasing can reduce costs and reduce the time required to get reliable, scalable data-driven decision making in place.
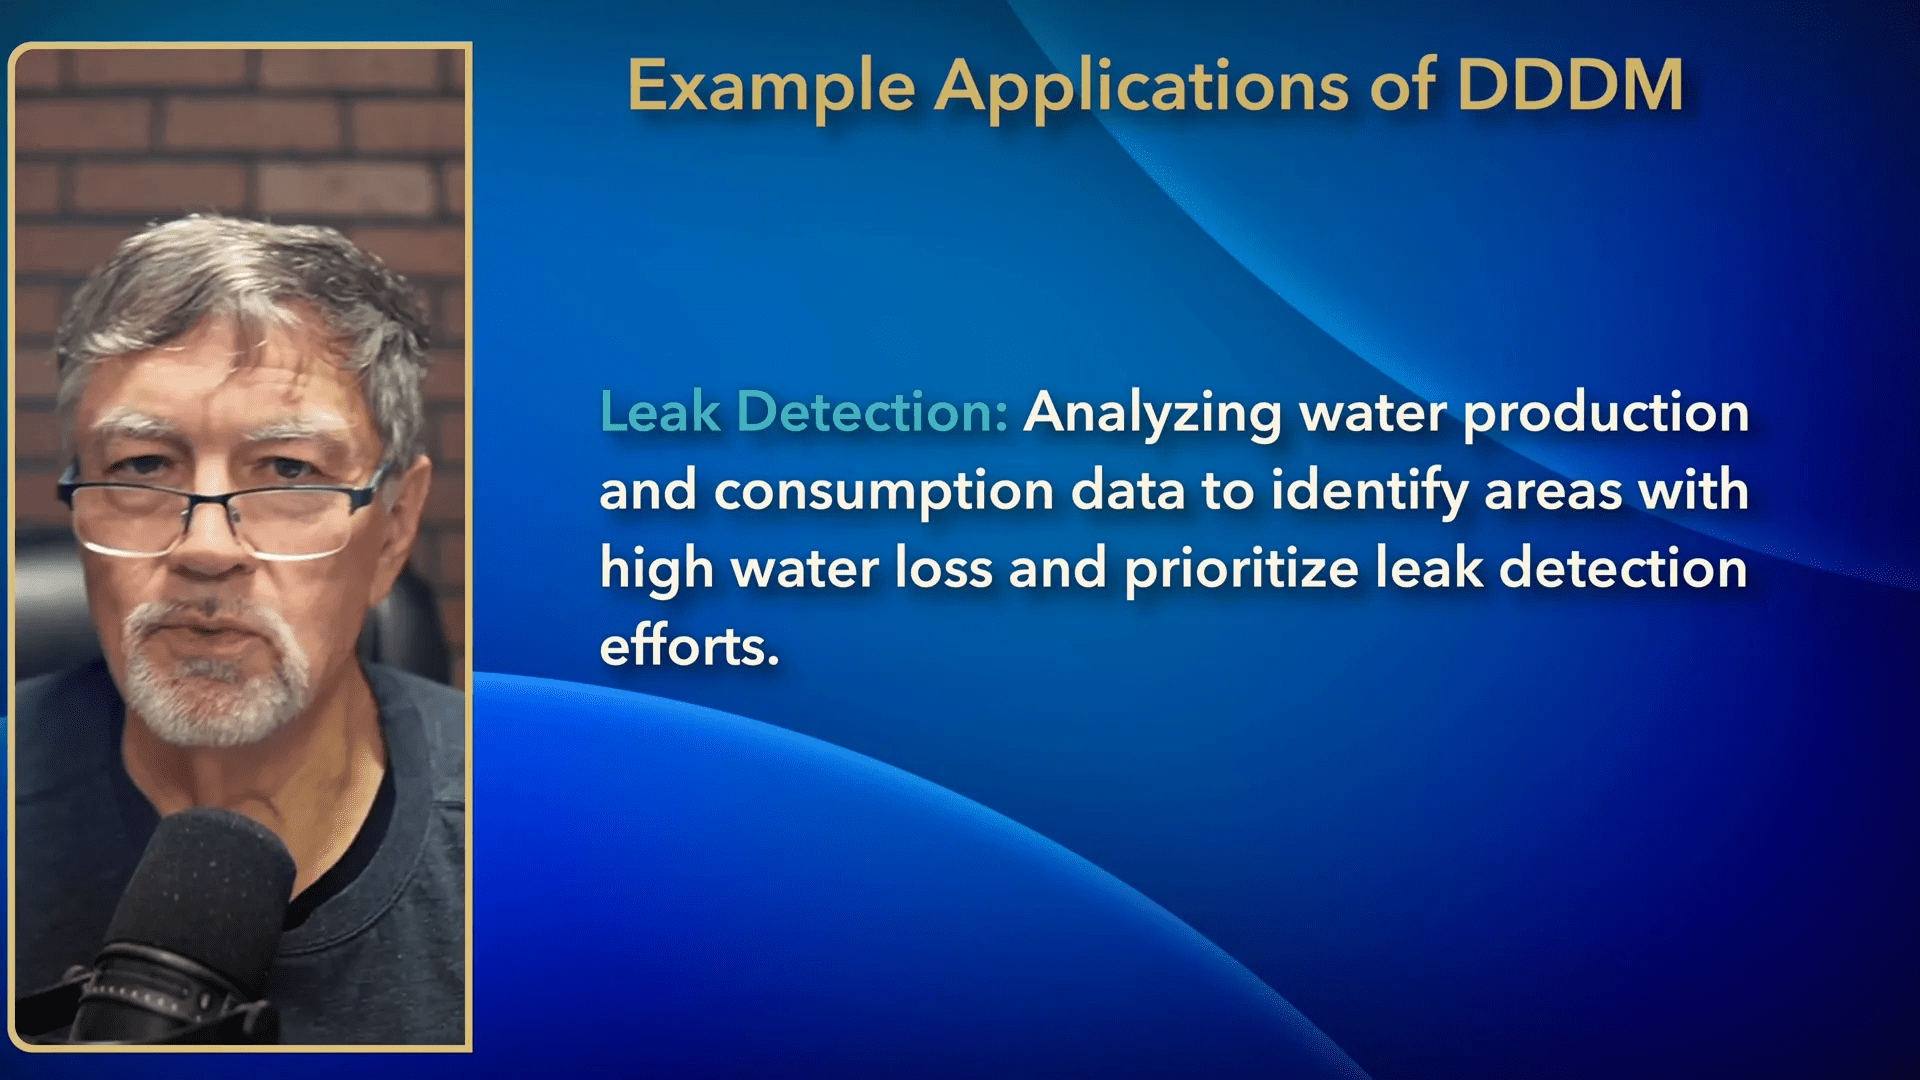
Step 11: Apply data-driven decision making to concrete problems
Once we have the basics in place, we apply data-driven decision making to a set of high-value use cases. Here are practical examples and how we approach them:
Leak detection (reactive → proactive)
We compare production volumes to billed consumption to locate areas with high water loss. For rapid identification, we prioritize zones with the biggest gaps and have SCADA or temporary flow logging in place to zero in on the problem. New tools such as satellite leak detection can complement acoustic listening, particularly in areas with aging mains.
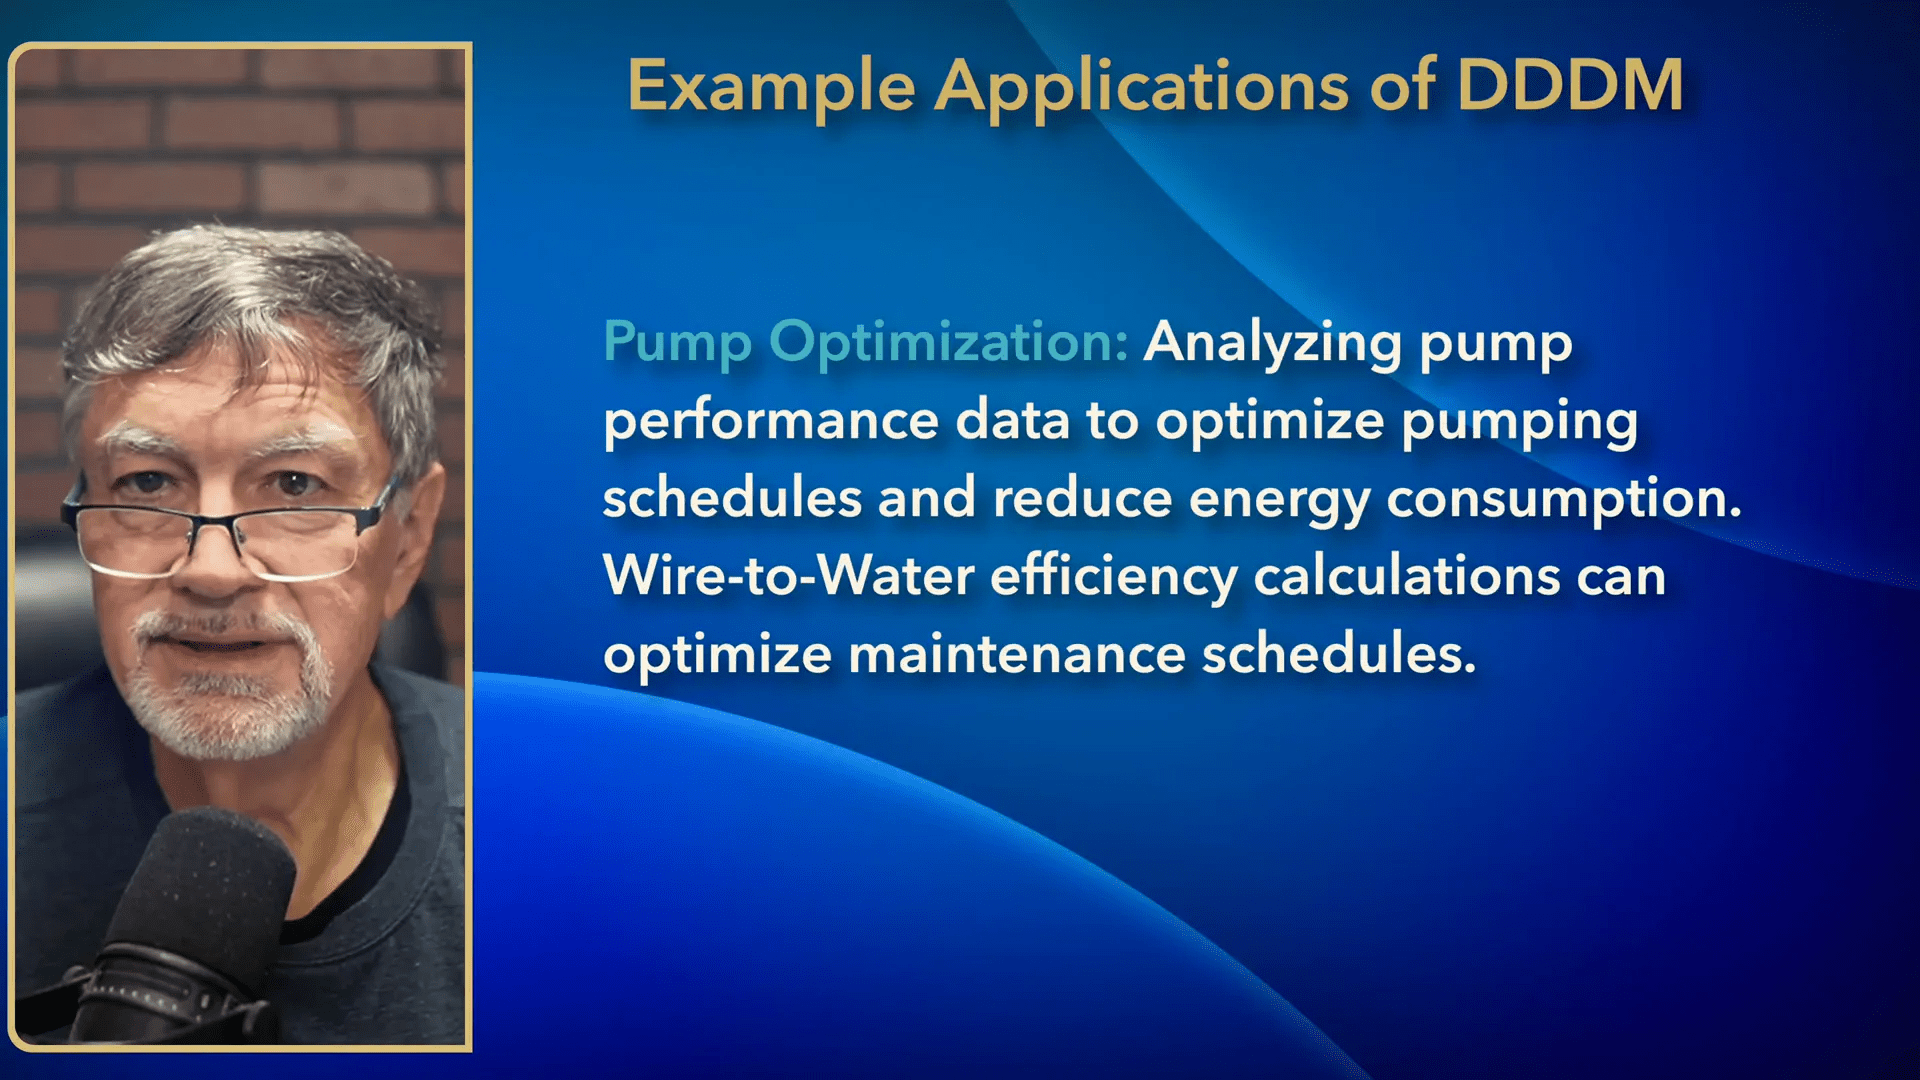
Pump optimization
We use pump runtime, flow, and energy data to calculate water-to-energy efficiency. Monitoring trends lets us schedule overhauls before catastrophic failure and optimize pump schedules to reduce energy costs. Vibration sensors add a layer of predictive insight — rising vibration often indicates bearing problems before they cause failures.
Water quality monitoring
Rather than react to an out-of-spec test, we trend residuals, iron, manganese, or arsenic values. Detecting a steady upward drift allows us to investigate source chemistry, blending, or treatment adjustments before regulatory limits are breached. The risk of fines and health problems makes this one of the most critical applications of data-driven decision making.
Customer service improvement
Customer complaints are a data source, not just a nuisance. We categorize service calls and complaints, look for spatial clustering, and tie them to asset condition or operational events. Repeated pressure complaints in one zone may indicate a valve or pump issue; billing complaints could point to meter replacement needs. Tracking complaint trends reduces repeat calls and improves customer satisfaction.
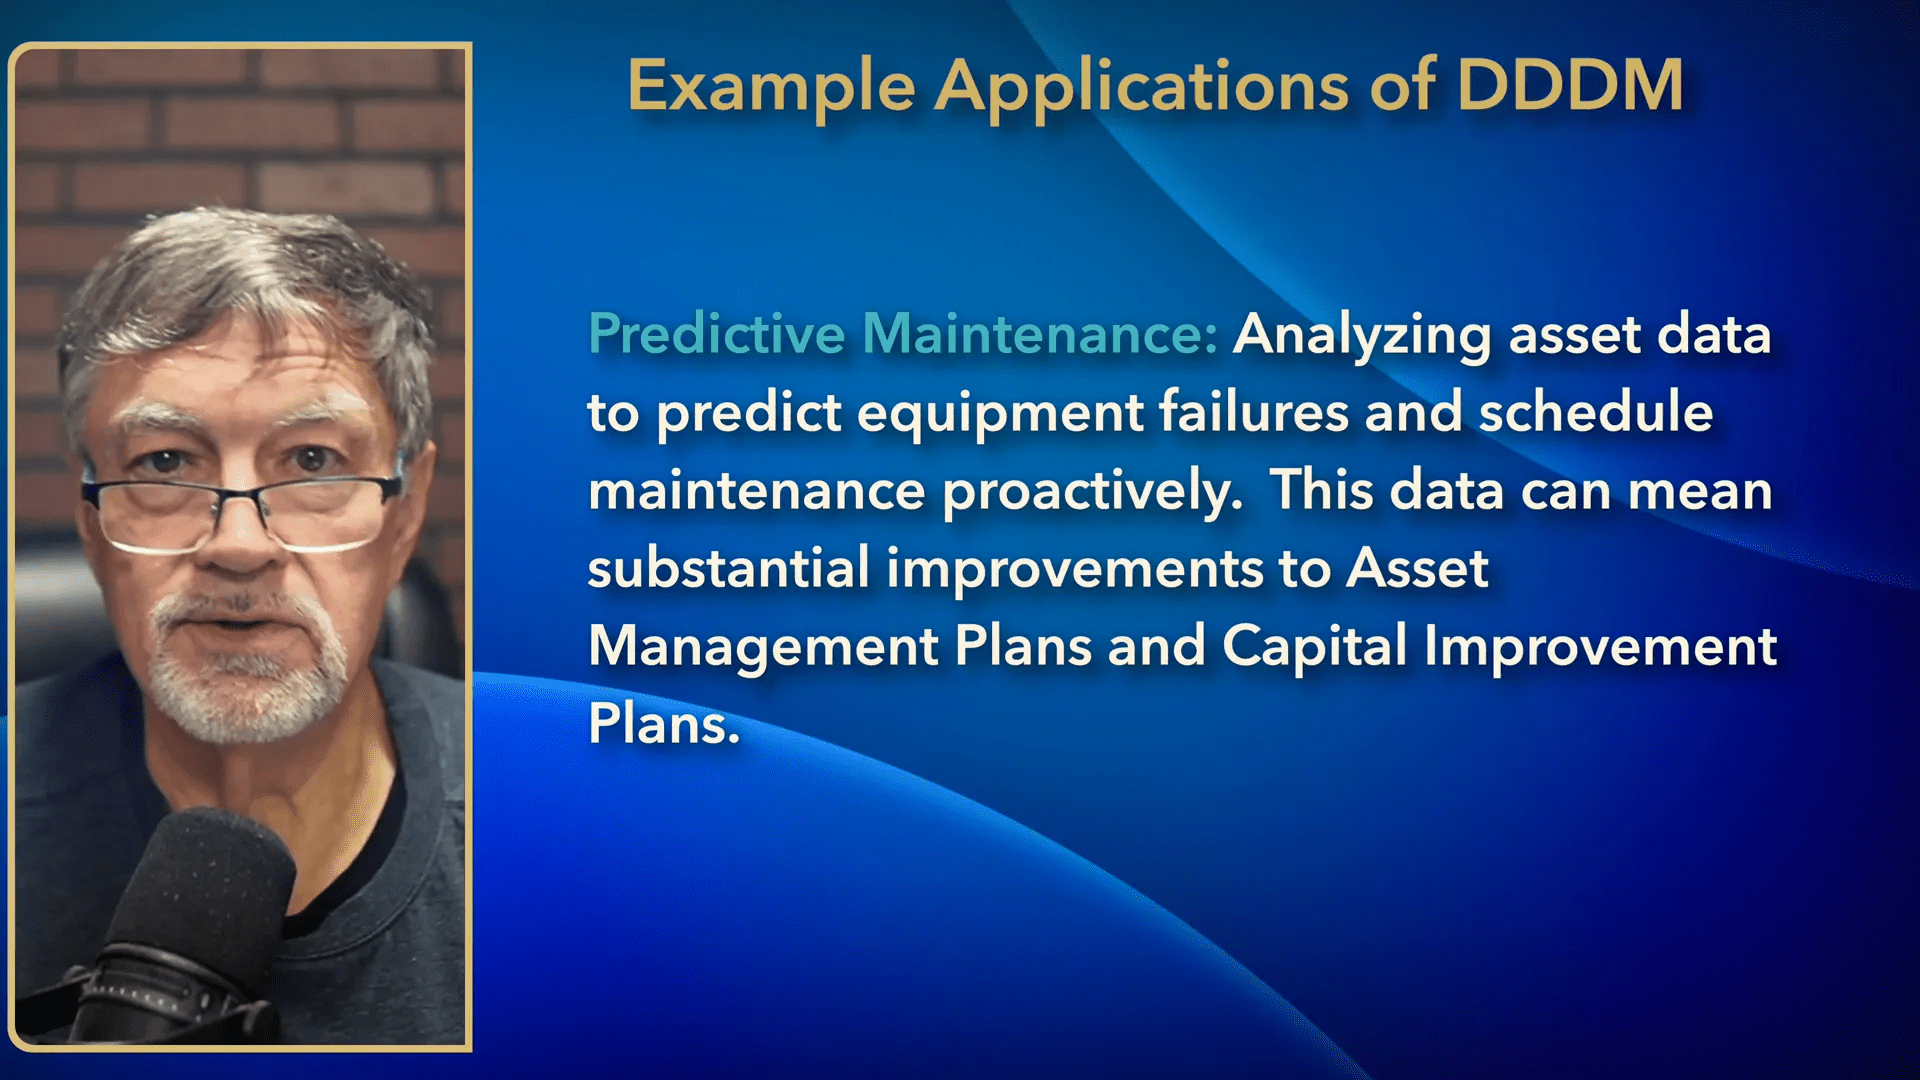
Predictive maintenance (most proactive)
Predictive maintenance is the pinnacle of data-driven decision making. By analyzing asset age, maintenance history, vibration, runtime, and other sensor inputs, we forecast failures and schedule maintenance during planned windows. This approach reduces emergency repairs, extends asset life, and can yield 20–40% savings in operating costs by avoiding catastrophic failures and less efficient emergency work.
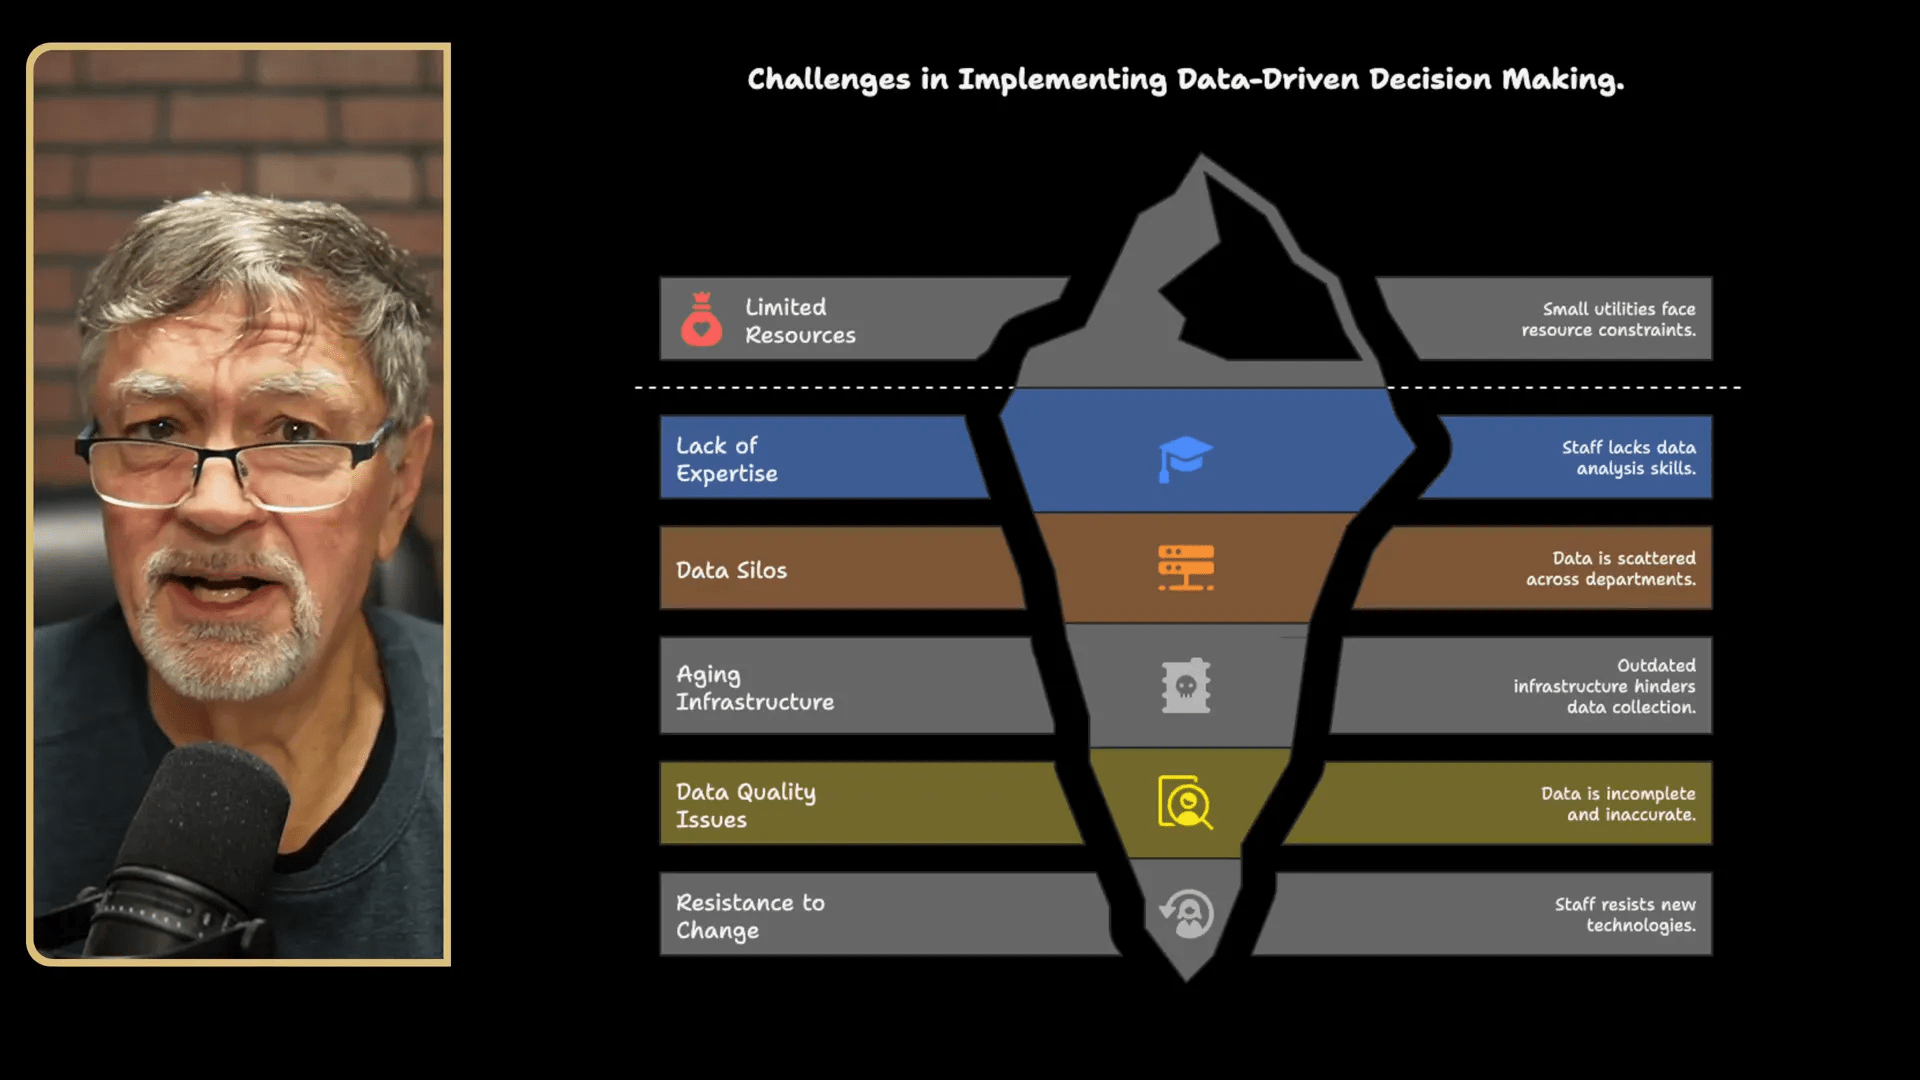
Step 12: Recognize and manage common challenges
Implementing data-driven decision making has predictable hurdles. We approach them with a realistic plan:
- Resource constraints: Small utilities often have limited budgets and staff time. Start small, use low-cost tools, and expand as benefits materialize.
- Lack of expertise: Provide training, use consultants for targeted gaps, and partner with peer utilities for shared learning.
- Data silos: Consolidate data into a central spreadsheet or simple database. Standardize formats so automated ingestion is possible.
- Aging infrastructure: Prioritize sensors and monitoring at the most critical assets first; plan capital projects based on data-driven asset criticality.
- Data quality: Improve measurement practices and validate inputs. Treat data quality as a KPI — track percent of records validated.
- Resistance to change: Break rollout into small, visible wins. Involve staff early, document SOPs, and make the process iterative.
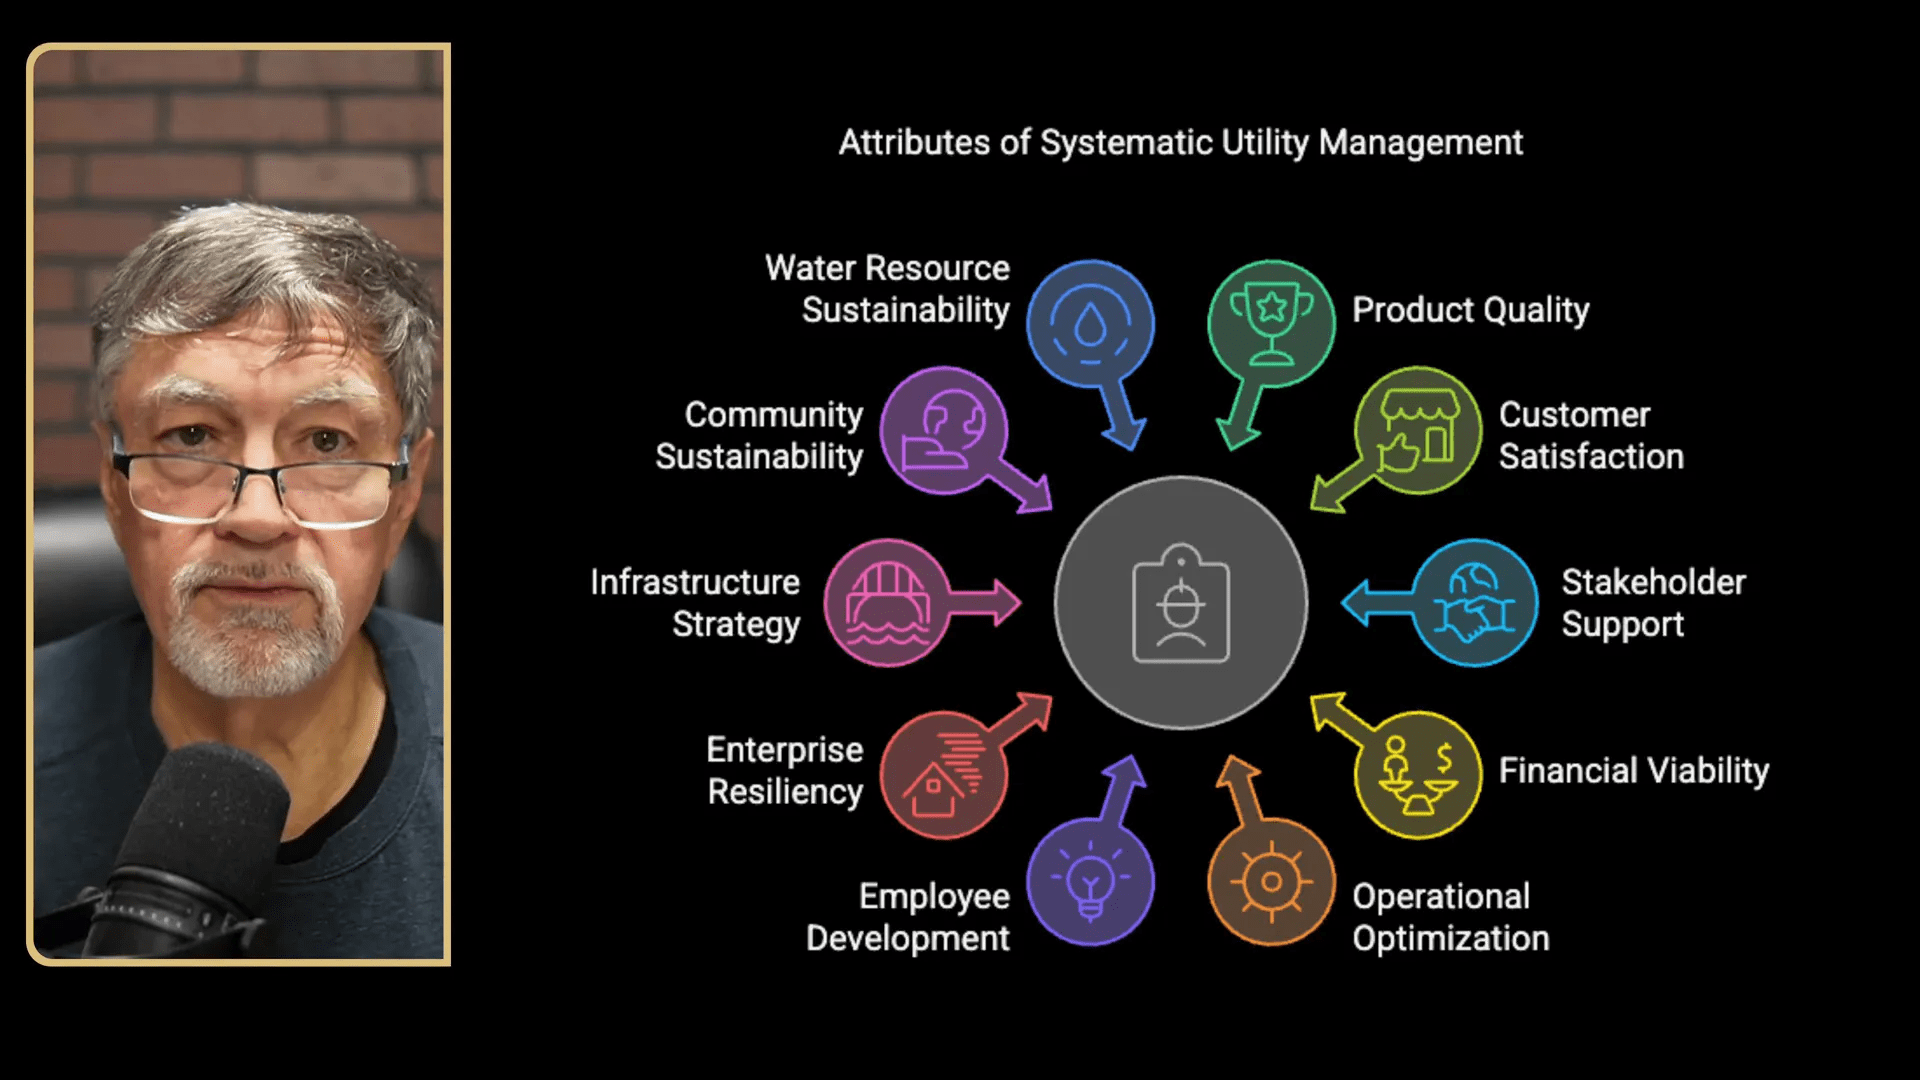
Step 13: Embed data-driven decision making into systematic utility management
Data-driven decision making supports nearly every attribute of systematic utility management: product quality, operational optimization, infrastructure strategy, financial planning, community sustainability, and stakeholder support. By integrating data into daily operations and long-term planning, we make our utility more resilient and efficient.
Make data part of routine meetings. Have operations review weekly KPI dashboards. Let management use KPI trends for rate studies and capital planning. Use asset condition and predictive maintenance forecasts to prioritize the capital improvement plan. When data-driven decision making feeds directly into governance and finance, we can make smarter rate decisions and sustain community trust.
Step 14: Iterate, improve, and scale
Data-driven decision making is not a one-time project; it is an iterative discipline. We continually:
- Review KPI performance and dashboard relevance
- Refine data collection and validation processes
- Adjust SOPs and training based on lessons learned
- Introduce new sensing or analytics where the ROI is clear
Iteration keeps the program current as new tools, AI capabilities, and vendor offerings emerge. We should schedule a semi-annual review to align data efforts with the capital plan and operational needs.
Step 15: Practical checklist to get started this month
If we take one tangible action this month, it should be to create a one-page Data Start Plan and run a 60–90 day pilot. Here’s a checklist we can implement right away:
- List 3 priority KPIs and confirm data sources for each.
- Identify a pilot project (leak detection, pump optimization, or water quality trending).
- Set up a shared Google Sheet for pilot data ingestion.
- Export one week of SCADA and production data into the sheet.
- Create simple charts for the KPIs and review them at the weekly ops meeting.
- Schedule a short staff training to explain roles and SOPs for the pilot.
- Contact one neighboring utility or consultant to share lessons or ask for a short peer review.
Conclusion: Treat our data as an asset
Data-driven decision making turns information from a compliance obligation into a daily asset. By starting small, focusing on high-impact KPIs, consolidating existing data, and layering in inexpensive technology and staff training, we can dramatically improve reliability, reduce costs, and strengthen our service to customers. The path to data-driven decision making is iterative, affordable, and within reach for even the smallest utilities. When we commit to regular trend analysis, SOPs, and staff buy-in, the rewards — fewer emergencies, smarter capital projects, better water quality, and happier customers — follow.
Remember the potential: predictive maintenance alone can reduce operating costs substantially, and leak reduction returns money directly to our financial health. Let’s start by piloting one use case, measuring the results, and scaling the approach. Data-driven decision making is not a future luxury — it is a practical way to protect our system and serve our community smarter, day after day.
If you want to dive deeper, there are resources and talks that expand on predictive maintenance, well health, and affordable sensing strategies. This guide gives us the practical steps to implement data-driven decision making now — and the roadmap to expand it over time.