
In this practical guide you’ll learn how to move your small utility from paper-based routines to precision, data-driven operations. The original presentation by The Groundwater Guy lays out a clear roadmap you can follow, with real-world case studies and step-by-step guidance. If you manage treatment plants, distribution networks, or collection systems, this article gives concrete steps to use your existing data—and modest investments—to improve reliability across your water infrastructure and operations.
Step 1: Assess your current state and constraints
Start by taking stock. You must inventory what you already collect and the systems that create it: SCADA logs, meter reads, maintenance records, customer complaints, and any spreadsheets or filing cabinets holding legacy notes. Create a simple data inventory that maps each dataset to where it lives and who owns it.
- List systems: billing, SCADA, GIS, work orders, lab results.
- Identify pain points: unknown leaks, frequent emergency repairs, capacity spikes, regulatory gaps.
- Establish baseline KPIs: non-revenue water percentage, average daily flow, treatment capacity utilization, customer complaints per month.
Be realistic about constraints: most small utilities face limited budgets, understaffing, and aging physical assets. These constraints shape priorities and mean you should focus initially on high-impact, low-cost measures that increase efficiency across the rest of your water infrastructure.
Step 2: Build the foundation—digitize and centralize
Your next step is to move records out of files and into a centralized, accessible location. Start small: digitize maintenance logs, upload meter histories, and store laboratory results in a consistent folder or cloud database. This foundation enables trend analysis and prevents knowledge loss when staff retire or leave.
- Digitize paper records and organize them by asset ID.
- Create a shared spreadsheet dashboard (Google Sheets works well) so staff and leadership can view the same information in real time.
- Invest in a modest GIS or mapping solution to tie assets to locations—this vastly improves response time and planning.
A properly modeled asset inventory connects decisions about replacements and repairs directly to your water infrastructure. When an asset is tied to location, condition, and failure history, prioritization becomes evidence based instead of anecdotal.
Step 3: Implement low-hanging fruit—monitoring and leak detection
Begin with measures that deliver quick, measurable ROI. Leak detection and reduction of non-revenue water are the highest-return starting points for most small utilities. You are paying to produce water—find ways to capture lost revenue and reduce treatment load.
Options scale with system size:
- Small systems (under 2,000 connections): basic SCADA-level monitoring and remote liquid-level sensors. Typical investment range $50k–$100k with potential year-one ROI of 200%–300% in favorable cases.
- Medium systems (2,000–10,000 connections): acoustic sensors, pressure management systems, GIS-integrated leak mapping, and satellite detection where applicable. Costs rise, but first-year ROI can exceed 300%.
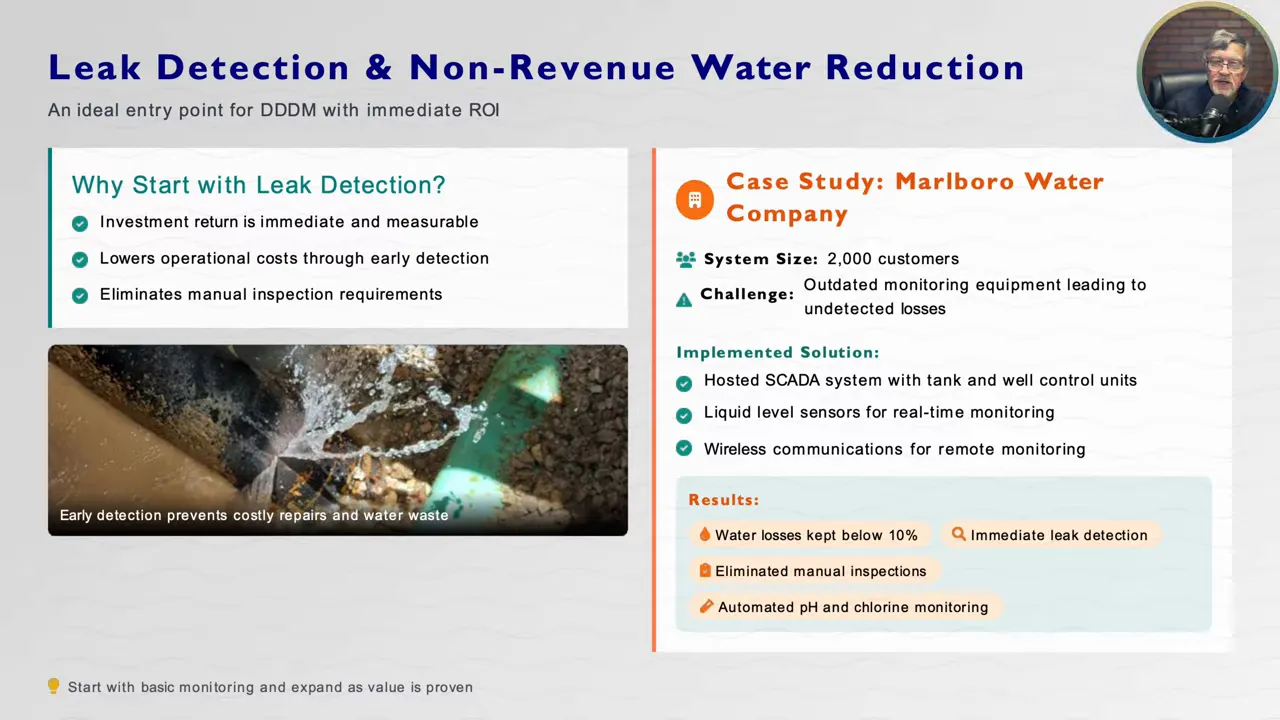
Case study — Marlboro Water Company: by deploying a hosted SCADA system with tank/well control units and wireless IoT liquid-level sensors, they maintained water loss below 10%, automated pH and chlorine monitoring, and reduced manual inspection burdens. That immediate visibility is the kind of improvement that turns a reactive operation into a proactive one.
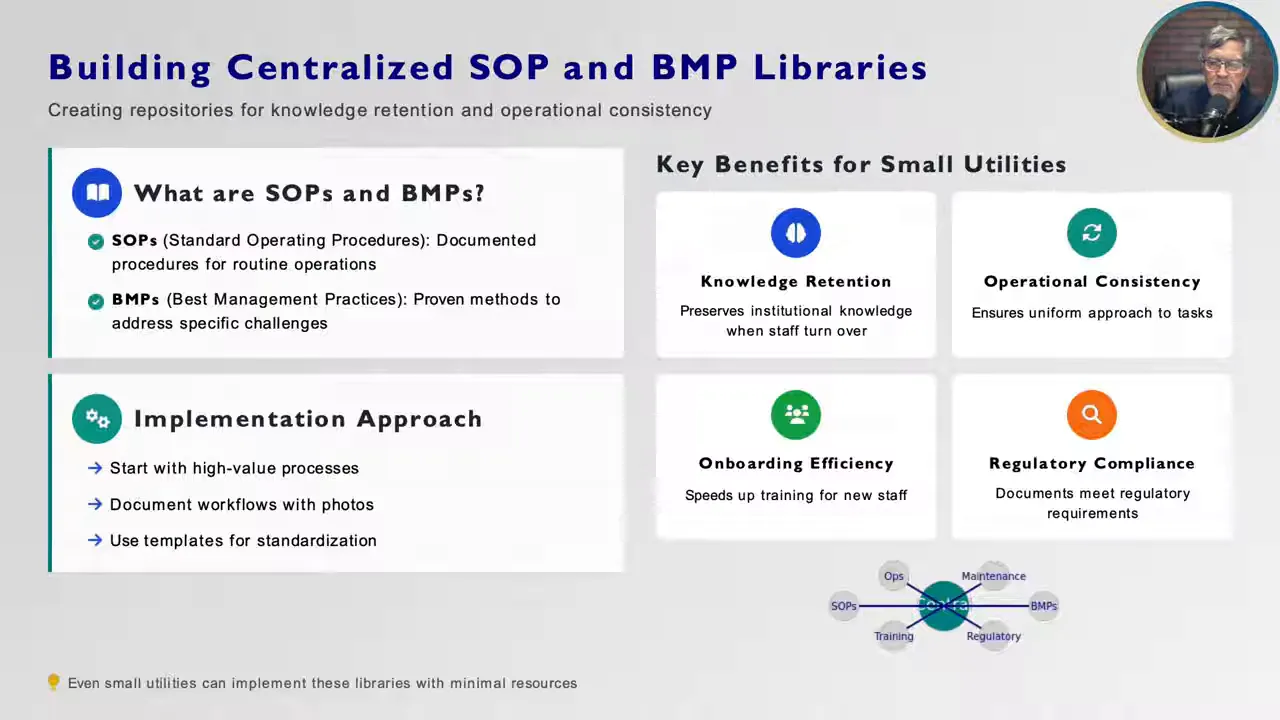
Step 4: Centralize SOPs and build a knowledge base
Operational consistency comes from clear Standard Operating Procedures (SOPs) and Best Management Practices (BMPs). You don’t need an encyclopedia; document high-value processes first: pump maintenance, emergency shutdown, chlorine dosing checks, pressure zone adjustments, and leak response workflows.
- Choose the top 10 processes that are mission-critical and prone to variation.
- Document procedures with photos or short videos; attach QR codes to equipment for field access.
- Store SOPs centrally and make them searchable; consider a simple AI assistant (custom GPT) to query procedures in the field.
These artifacts preserve institutional knowledge and accelerate onboarding—critical when the workforce faces the “silver tsunami.” SOPs also support regulatory compliance and reduce mistakes that escalate into asset failures across your water infrastructure.
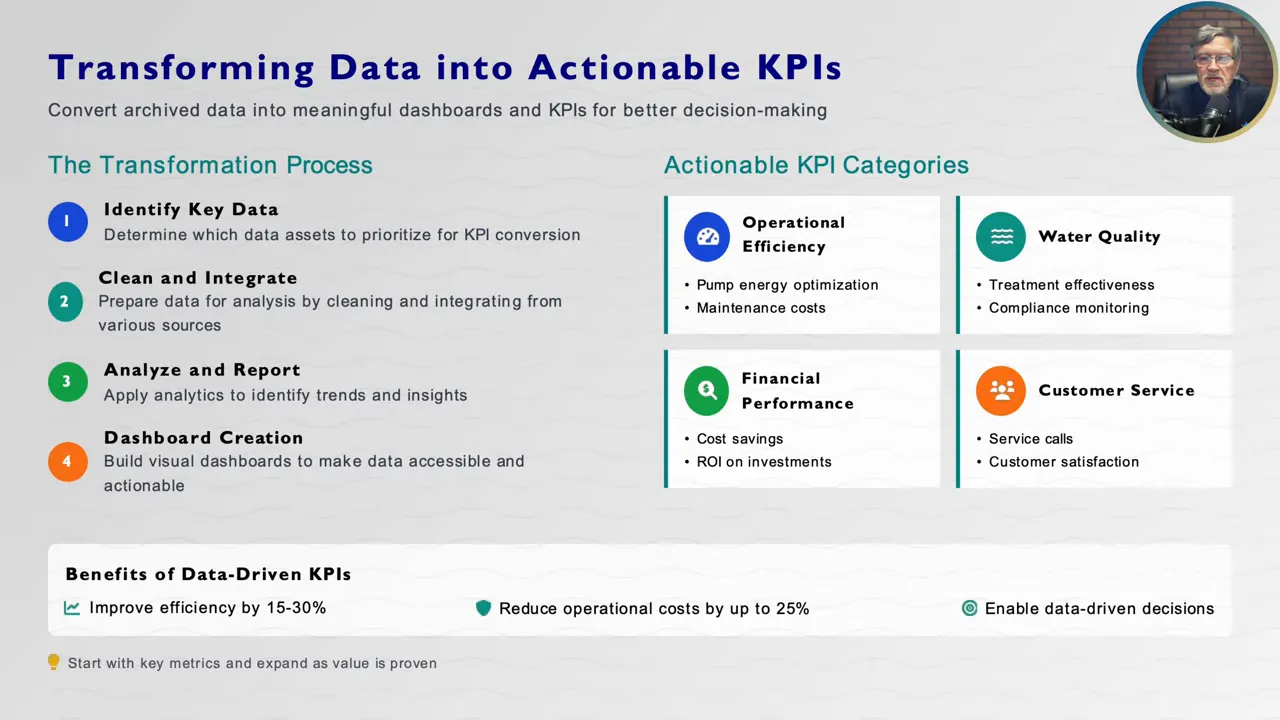
Step 5: Convert data into KPIs and visual dashboards
With data centralized and SOPs in place, convert archive data into actionable KPIs. Focus on five to seven high-impact indicators so your staff and board can quickly understand performance. Common KPI categories include:
- Operational efficiency: non-revenue water, leaks detected per month, mean time to repair.
- Financial: cost per million gallons treated, revenue collection rate.
- Customer service: complaints per 1,000 customers, service call resolution time.
- Water quality and regulatory compliance: average residual chlorine, lab exceedances.
Visualization matters: dashboards let you spot trends, not just isolated incidents. Trends are the basis for predictive maintenance—spotting slowly deteriorating assets before they fail.
Step 6: Analysis—apply analytics, AI, and predictive models
Start by analyzing what you already have. Use spreadsheet-based analytics or low-cost cloud tools to test hypotheses: Do mainline leaks spike at night? Are certain pipe materials failing earlier? Then move toward predictive models.
Examples of analytics-driven improvements:
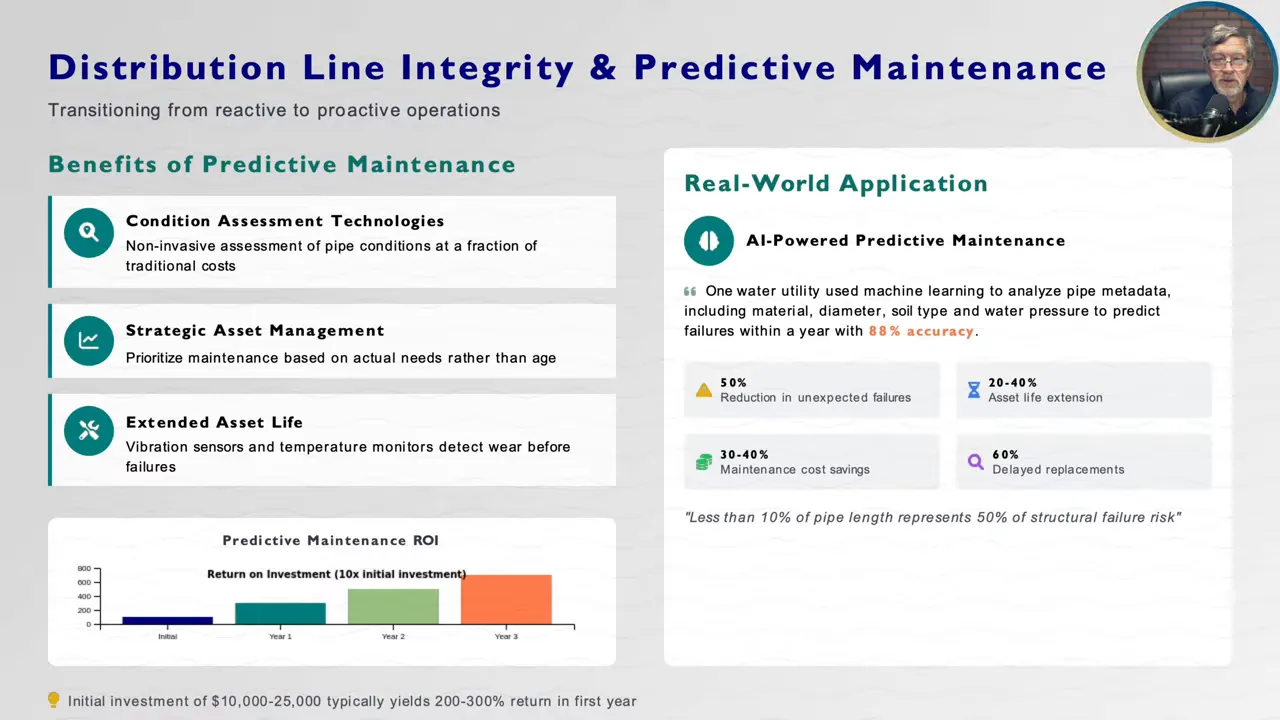
- AI for pipe failure prediction: machine learning models that use pipe metadata (material, diameter, soil type, pressure) can predict failures within a year with high accuracy (reported up to ~88%). Use risk color-coding in GIS to prioritize replacements.
- Pump health monitoring: vibration and temperature sensors reduce unplanned pump failures by up to 50% and extend life by 20–40% with early component detection.
When you use analytics to guide capital planning, you convert budget requests into defensible projects tied directly to the condition of your water infrastructure.
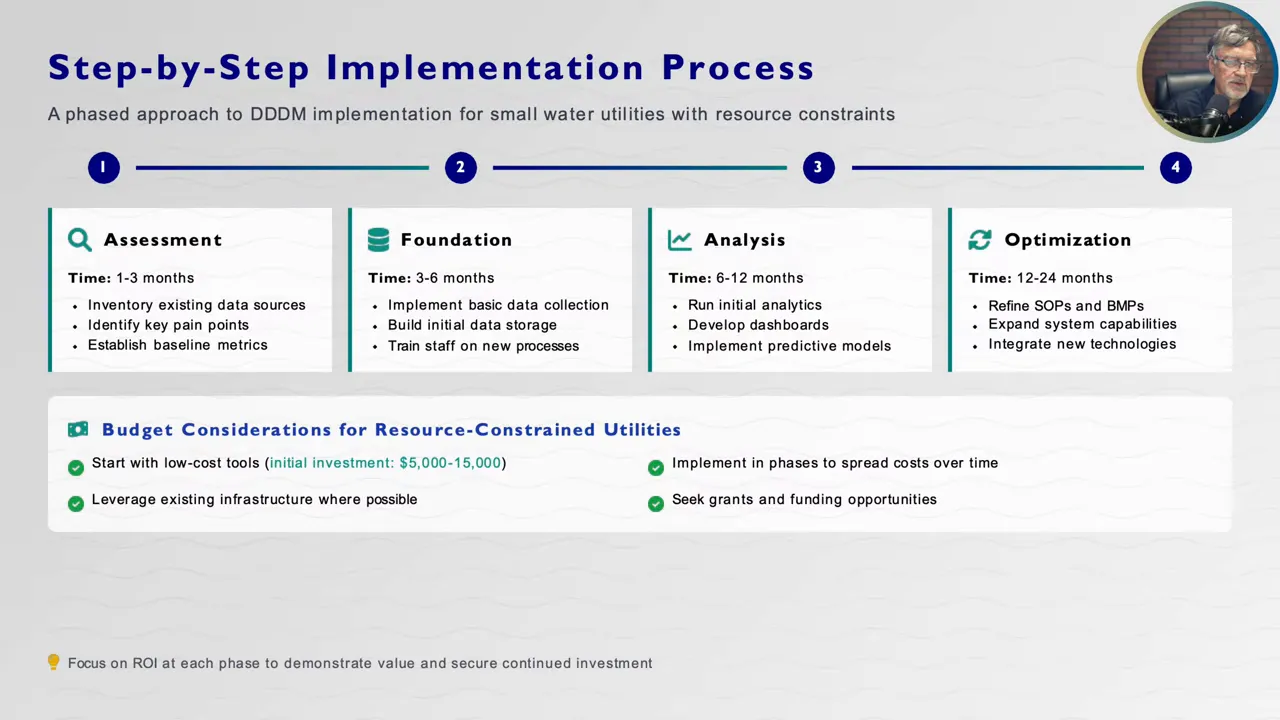
Step 7: Optimize iteratively—expand scope and refine processes
Digital transformation is iterative. After initial wins, scale gradually: add more sensors, automate reporting, expand SOP coverage, and integrate more systems into the central platform. The typical timeline looks like this:
- Assessment: 1–3 months
- Foundation (digitize and collect): 3–6 months
- Analysis (dashboards, initial predictive models): 6–12 months
- Optimization and scaling: 12–24 months and ongoing
Keep the team engaged: celebrate wins (even with a small office party), highlight ROI in the board packet, and use demonstrable savings—reduced treatment volumes, fewer emergency repairs, lower energy use—to justify next-phase funding.
Step 8: Funding, tools, and partnerships
Most small utilities don’t need to shoulder the entire cost. Seek grants and financing: EPA State Revolving Funds, USDA programs, Water Infrastructure Finance programs, and creative public-private partnerships. Keep purchases scalable—cloud SCADA and modular IoT sensors let you grow as funding allows.
Low-cost tools to explore:
- Google Sheets dashboards for shared KPI views.
- Affordable GIS providers (e.g., Diamond Maps) to get mapping without enterprise costs.
- Hosted SCADA platforms for remote monitoring without big on-site servers.
- EPA’s Rural and Small Systems guides and other training resources from state rural water associations.
Step 9: Maintain momentum—governance and continuous improvement
Create a small “data champion” team to oversee data quality, run dashboards, and coordinate SOP updates. Standardize templates so everyone knows where to store and find asset information. Schedule quarterly reviews to track KPIs and adjust priorities for the capital improvement plan.
Collaboration with neighboring utilities amplifies learning: share anonymized failure records, joint procurement for sensors, or pooled training budgets. When multiple utilities adopt similar data-driven practices, the community benefits from more resilient water infrastructure at lower per-utility cost.
Conclusion: Practical transformation, measurable gains
You don’t need to replace everything at once. Start with data you already collect and focus on leak detection and non-revenue water reduction to achieve the fastest wins. Build SOPs for your highest-value processes and convert archive data into five to seven clear KPIs. Use GIS and modest SCADA/IOT investments to connect location, condition, and performance so that your decisions about the water infrastructure are evidence based and defensible.
Follow the phased approach: assess, build the foundation, analyze, and optimize. With modest investments and careful prioritization, you can move from reactive “run-to-failure” operations to predictive, data-driven maintenance that stretches limited budgets and improves service reliability.
If you implement these steps, you will reduce unexpected failures, lower operating costs, and present clearer, data-backed plans to your board—making it far easier to secure funding and protect your community’s water infrastructure for the long term.
Practical templates and next steps
Use these ready-to-adopt templates and checklists to accelerate your transition from paper to precision. Paste them into your shared drive or print for field crews.
1. Quick assessment checklist
- Inventory collected: SCADA, billing, GIS, lab results, work orders
- Owner mapped for each dataset
- Top 3 pain points identified
- Baseline KPIs recorded (non-revenue water, avg daily flow)
- Funding opportunities logged
2. SOP template (one-page)
- Title: [Process name]
- Purpose: One-sentence objective
- Scope: Assets/areas covered
- Steps: Numbered actions with responsible role
- Frequency: When to run (daily/weekly/monthly)
- Attachments: Photo, video, or diagram filename
3. Five KPIs to start with
- Non-revenue water (%)
- Leaks detected / month
- Mean time to repair (hours)
- Cost per MG treated
- Customer complaints / 1,000 customers
4. 60-day starter plan
- Weeks 1–2: Complete data inventory and assign owners.
- Weeks 3–4: Digitize top 3 paper records and create shared dashboard.
- Weeks 5–6: Implement one monitoring pilot (tank level or pressure sensor).
- Weeks 7–8: Publish 3 SOPs and run first KPI report.
5. Field-ready note (printable)
Attach this short card to crews’ clipboards: “Report leaks immediately, log asset ID, take photo, tag SOP name.”
These additions are designed to be copied directly into your existing workflows and storage (Google Drive, shared network folder, or your GIS/CMMS). If you later provide a set of URLs or resource links, we can integrate them into the exact anchor text locations in the post.